FIGURE SUMMARY
- Title
-
CRISPR/Cas9 screen in human iPSC-derived cortical neurons identifies NEK6 as a novel disease modifier of C9orf72 poly(PR) toxicity
- Authors
- Guo, W., Wang, H., Kumar Tharkeshwar, A., Couthouis, J., Braems, E., Masrori, P., Van Schoor, E., Fan, Y., Ahuja, K., Moisse, M., Jacquemyn, M., Furtado Madeiro da Costa, R., Gajjar, M., Balusu, S., Tricot, T., Fumagalli, L., Hersmus, N., Janky, R., Impens, F., Vanden Berghe, P., Ho, R., Thal, D.R., Vandenberghe, R., Hegde, M.L., Chandran, S., De Strooper, B., Daelemans, D., Van Damme, P., Van Den Bosch, L., Verfaillie, C.
- Source
- Full text @ Alzheimers Dement
|
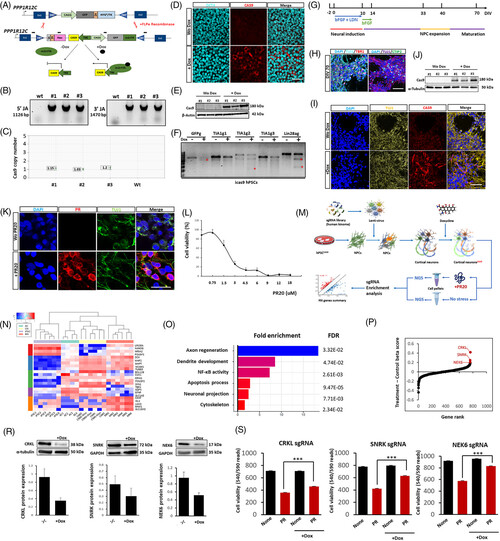
Kinome-wide CRISPR/Cas9 interference screen in doxycycline-inducible Cas9-iPSC-derived cortical neurons. (A) Schematic diagram of the strategy used to create inducible expression of Cas9 in iPSC lines: schematic representation of the AAVS1 locus, engineered to contain a flippase recognition target (FRTs)-flanked cassette suitable for recombinase-mediated cassette exchange (RMCE) using the pZ: F3-P TetOn-3×F-Cas9-F flanked by FRTs.17 This donor vector also contains a Tet-On system, including the M2 reverse tetracycline transactivator (M2rTA) and a tetracycline response element (TRE) upstream of a minimal cytomegalovirus (CMV) promoter. Neo: neomycin. (B) Identification of correctly targeted Cas9-iPSC cell clones by PCR, amplifying the 3′ and 5′ junctions (#1, #2, #3 denote the clone number, JA: Junction assay). (C) Digital droplet PCR (ddPCR) detection of copy number of CAS9 in the BJ1 iPSC line. (D) Immunostaining validation of Cas9 expression after doxycycline (3 μg/ml for 5 days) treatment in iPSCs. (E) Western blot validation of Cas9 expression after doxycycline treatment. (F) T7EI assay for Cas9-mediated cleavage in BJ1 Cas9-iPSCs using single sgRNAs targeting GFP (GFPg), T-cell-restricted intracellular antigen-1 (TIA1; TIA1g1, TIA1g2, TIA1g3), Lin-28 homolog A (LIN28A; LIN28Ag). (G) Schematic protocol of cortical neuron differentiation. LDN = LDN-193189. (H) Staining of DIV 80 PSC-cortical neuronal progeny for different cortical neuron markers (CTIP2 (or BCL11B) and T-box brain transcription factor 1 (TBR1)), neuron tubulin marker TUJ1 and DAPI. (I, J) Western blot and immunostaining for Cas9 expression in DIV80 PSC-neural progeny. (K) PR20 at a dosage of 6 μM was visualized by immunocytochemistry in DIV80 neural progeny treated with or without PR20, Scale bar = 20 μm. (L) PR20 dose-dependent cytotoxicity of DIV80 iPSC-neuronal progeny was measured by cell viability assay after a 24 hours treatment. (M) Schematic diagram of CRISPR/Cas9 screen procedure: DIV46 NPCs were transduced with the kinome-wide Brunello sgRNA vector library and transduced cells were selected with 1 μg/ml puromycin; NPCs were differentiated to DIV70 cortical neurons, after which 3 μg doxycycline was added for 5 days to induce Cas9, followed by treatment of 50% of the DIV 79 neuronal progeny with or without 6 μM PR20. The surviving cells were subjected to deep sequencing and statistical analysis for sgRNA distribution. Five biological replicates were performed. (N) RNA sequencing was performed on DIV80 iCas9 cortical neurons not treated with PR20, collected in parallel with the screen. Shown is expression of genes typically found in astrocytes (AC), cortical neurons (CN), iPSC and motor neurons (MN) (control iPSC, AC, and MN obtained from public available data with Gene Expression Omnibus (GEO) accession number: GSE98290). (O) Functional enrichment of candidate modifiers (113 genes that upon KO enhance survival under PR20 treatment) identified from the screen based on Gene Ontology Resource. (P) Hit gene distribution with normalization by negative control sgRNAs. (R) Western blot for NEK6, SNRK or CRKL in DIV80 neurons (normalized to α-Tubulin or GAPDH) following transduction with single sgRNAs against NEK6, SNRK, or CRKL, respectively. (S) Cell viability of Cas9-iPSC-derived DIV47 neurons transduced with single sgRNA guide against NEK6, SNRK, or CRKL with and without 6 μM PR20 treatment for 24 hours (n≥10). Data were plotted as mean ± SEM. Statistical significance was evaluated with one-way ANOVA and post-hoc Tukey's test; *,**,*** P values of <0.05, <0.01, <0.001 respectively. Scale bar = 50 μm
|
|
NEK6 interference prevents poly(PR) toxicity in vitro and in vivo. (A) Representative kymographs of axonal transport recording in iCas9-iPSC-derived cortical neurons obtained from iCas9-iPSC-derived cortical neurons transduced with NEK6 sgRNA loaded with Mito-Tracker-Red (-/- = no treatment; +PR20 = PR20 treatment; +GR20 = GR20 treatment; +Dox = 3 μg doxycycline treatment). (B) Quantification of total mitochondria, moving mitochondria and ratio of moving mitochondria to total mitochondria normalized to a neurite length of 100 μm during 200 s in (A). (C) Representative kymographs of cortical neurons from two different C9orf72 patient iPSC as well as the respective isogenic control iPSC-derived neurons treated with or without different NEK6 ASOs for 1 week. (D) Quantification of total mitochondria, moving mitochondria and ratio of moving mitochondria to total mitochondria normalized to a neurite length of 100 μm during 200 s in (C). (E) Schematic representation of the different steps to identify phosphorylation sites by mass spectrometry. The blue dots represent a phosphorylation site in proteins/peptides. The blue/red lines in the MS spectra represent site-determination. Interpretation of MS spectra involved both the identification of phosphopeptides and localization of the sites of phosphorylation. The final determination of phosphopeptides was calculated by referencing to the corresponding peptides from shot gun MS spectra. (F) Heatmap of identified phosphorylation sites in proteins involved in axonal transport and nucleocytoplasmic transport machineries. (G) The nek6 splice-blocking morpholino targets the exon5 intron5 splice junction of zebrafish nek6 pre-mRNA. (H) RT-PCR validation of morpholino-mediated nek6 modified splicing in zebrafish embryos at 30 hpf. Non-target morpholino at the highest concentration is used as standard control. Wild type nek6 is amplified as a 435 bp band, while aberrantly spliced nek6, induced by morpholino injection, is amplified as a 326 bp band. (I) Western blot validation of morpholino-mediated nek6 knockdown in zebrafish embryos at 6 hpf (normalized to Ponceau total protein staining). (J) Visualization of motor axons by immunohistochemistry (SV2 antibody) of 30 hours post fertilization (hpf) zebrafish embryos injected with 0.844 μM GFP mRNA, 0.844 μM poly(PR) mRNA, 0.844 μM poly(PR) mRNA plus 0.5 mM control morpholino or 0.844 μM poly(PR) mRNA plus 0.5 mM nek6 morpholino; scale bar = 50 μm. (K) Quantification of axonal length (data represent mean ± 95% CI; one-way ANOVA) and aberrant axonal branching (data represent mean ± 95% CI; logistic regression) of zebrafish embryos in the four conditions; n = 4 biological replicates. All axonal transport measurements were performed on cortical neurons at DIV = 80-85; Number of neurons wherein axonal transport was measured ≥15 per data point; Kymographs scale bar time (vertical): 35 s; scale bar distance (horizontal): 25 μm. Data were plotted as mean ± SEM. Statistical significance was evaluated with one-way ANOVA and post-hoc Tukey's test; *, **, ***, ****P values < 0.05, <0.01, <0.001, and <0.0001, respectively
EXPRESSION / LABELING:
|
|
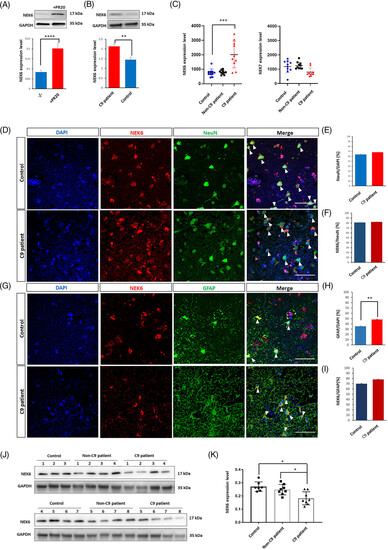
NEK6 expression profile in human iPSC-derived neurons and C9orf72 postmortem brain tissues. (A) Western blot analysis for NEK6 expression in iPSC-derived cortical neurons w/wo 1.5 μM PR20 treatment. (B) Western blot analysis of NEK6 expression in C9orf72 patient-derived cortical neurons and their isogenic controls. (C) qPCR detection of NEK6 and NEK7 transcripts in PBMCs of healthy donors (control, n = 10), sporadic ALS patients without known mutations (Non-C9 patient, n = 10) and ALS patients carrying C9orf72 mutation (C9 patient, n = 10). (D) Immunostaining of NEK6 and NeuN in postmortem motor cortex tissues from C9orf72 patients and non-neurological disorder case controls (white arrows indicate the colocalized NEK6 and NeuN staining). (E) Quantification of neuronal cell percentage in both conditions from (D). (F) Quantification of NEK6 expressing cell percentage in neuronal population from (D). (G) Immunostaining for NEK6 and GFAP in postmortem motor cortex tissues from C9orf72 patients and non-neurological disorder case controls (white arrowheads indicate the colocalized NEK6 and GFAP staining). (H) Quantification of astrocyte percentage in both conditions from (G). (I) Quantification of NEK6 expressing cell percentage in astrocytes population from (G). (J) Western blot analysis of NEK6 expression in motor cortex tissue from ALS or FTD patients carrying C9orf72 mutations (C9 patient, n = 8), non-neurological disorder case controls (Control, n = 7) and ALS or FTD patients that do not carry C9orf72 mutations (Non-C9 patient, n = 8). (K) Quantification of (J). The images shown as a representative example were C9-1 case and Con-6 case. The quantification of the images was based on the C9-1 and C9-7 cases, and the Con-6 and Con-8 cases. For details about the human cases see Table S4. Data were plotted as mean ± SEM. Statistical significance was evaluated with one-way ANOVA and post-hoc Tukey's test; *, **, *** P value of <0.05,<0.01, <0.001, respectively
|
|
Inhibiting NEK6 counteracts p53 pathway activation, DNA damage and axonal transport defects caused by DPRs/C9orf72 mutation. (A) Heat map for p53 pathway-related gene expression from RNA sequencing of DIV80 iCas9 cortical neurons w/wo PR20 treatment. (B) Western blot analysis of DNA damage marker p53BP1 and γH2AX in iCas9-iPSC-derived cortical neurons obtained from iCas9-iPSC-derived cortical neurons transduced with NEK6 sgRNA w/wo PR20 treatment. (C) Western blot analysis for p53-related senescence gene expression (p53 and p21) in all conditions from (B). (D) Representative kymographs of axonal transport recordings in iPSC-derived cortical neurons treated with PR20 peptides and different concentrations of the NEK6 inhibitor, inhibitor 8 (DC12465, DC chemicals, China) starting 3 days before adding PR20. (E) Quantification of total mitochondria, moving mitochondria and ratio of moving mitochondria to total mitochondria normalized to a neurite length of 100 μm during 200 s in (D). (F) Representative kymographs of axonal transport recording in C9orf72 patient and their isogenic control-derived cortical neurons w/wo NEK6 inhibitor 8 treatment (3.5 μM, 3 days). (G) Quantification of total mitochondria, moving mitochondria and ratio of moving mitochondria to total mitochondria normalized to a neurite length of 100 μm during 200 s in (F). (H) LA-PCR of hPRT genes in C9orf72 patient1 and its isogenic control-derived cortical neurons w/wo NEK6 inhibitor 8 treatment. (I) LA-PCR of hPRT genes in C9orf72 patient 2 and its isogenic control-derived cortical neurons w/wo NEK6 inhibitor 8 treatment. (J) Western blot analysis of p53 expression in (I). (K) Western blot analysis of DNA damage marker p53BP1 and γH2AX in neurons from iPSC derived from C9orf72 patient 1 and its isogenic control-derived cortical neurons following NEK6 inhibitor treatment. (L) Western blot analysis of DNA damage marker p53BP1 and γH2AX in neurons from iPSC derived from C9orf72 patient 2 and its isogenic control-derived cortical neurons following NEK6 inhibitor treatment. Data were plotted as mean + SEM. Statistical significance was evaluated with one-way ANOVA and post-hoc Tukey's test; *,**,***, **** P value of <0.05, <0.01, <0.001, <0.0001, respectively
|
Acknowledgments
This image is the copyrighted work of the attributed author or publisher, and
ZFIN has permission only to display this image to its users.
Additional permissions should be obtained from the applicable author or publisher of the image.
Full text @ Alzheimers Dement


