
- Title
-
The ESX-4 substrates, EsxU and EsxT, modulate Mycobacterium abscessus fitness
- Authors
- Lagune, M., Le Moigne, V., Johansen, M.D., Vásquez Sotomayor, F., Daher, W., Petit, C., Cosentino, G., Paulowski, L., Gutsmann, T., Wilmanns, M., Maurer, F.P., Herrmann, J.L., Girard-Misguich, F., Kremer, L.
- Source
- Full text @ PLoS Pathog.
(A) Schematic representation of the PHENOTYPE:
|
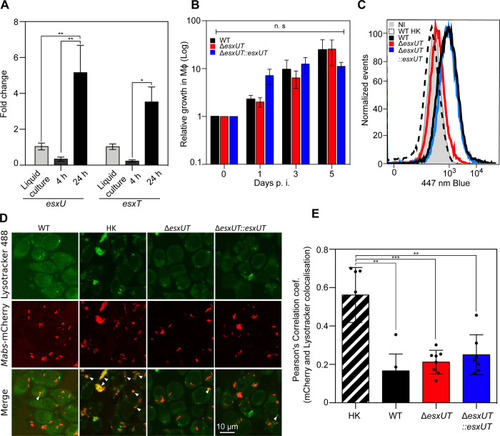
(A) Expression of |
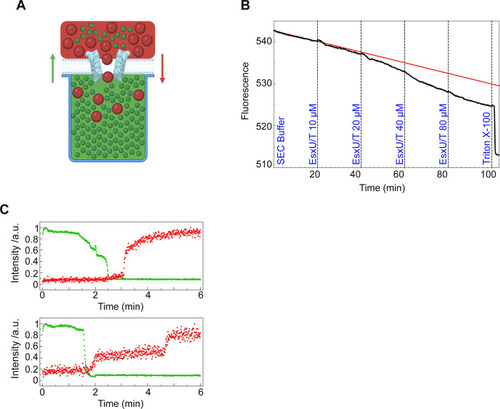
(A) Schematic of the NanoSpot method. DOPC bilayers were built over cavities filled with a fluorescent dye (green). A second fluorescent dye of known size (red) was added to the top of the membrane prior to addition of the protein complex. Fluorescent signals were continuously measured. (B) Dye influx and efflux using the NanoSpot technique. DOPC bilayers were formed at 37°C and pH 7.2 on top of cavities filled with Atto488 carboxy fluorescence dye. Fluorescence (black curve) decreased as more protein was added (final EsxU/EsxT concentration is indicated in blue). Upon addition of Triton X-100, fluorescence decreased abruptly. The red curve represents the trend line of fluorescence loss by photo-bleaching if no protein had been added. Over 300 cavities covered with DOPC membrane are plotted in this graph. (C) 40, 000 MW TexasRed-labelled dextran was added to the media outside the cavities before the EsxU/EsxT complex was supplemented to the well (final concentration: 10 μM). Green dots represent efflux of Atto488 carboxy efflux dye and red dots represent influx of TexasRed dye. Each graph represents one cavity. |

(A) Zebrafish were injected with 250–300 CFU of |