
- Title
-
Environmentally relevant concentrations of tris (1,3-dichloro-2-propyl) phosphate induce growth inhibition and oxidative stress in silver carp (Hypophthalmichthys molitrix) larvae
- Authors
- Yang, H., Pu, Y., Liu, C., Gao, L., Duan, X., Liu, S., Chen, D., Zhong, L., Li, Y.
- Source
- Full text @ Ecotoxicol. Environ. Saf.

Fig. 1. Effects on body length (A) and body mass (B) of silver carp larvae exposed to different concentrations of TDCIPP at 7, 14 and 28 days. Values are the mean ± SD (n = 30). The different lower-case above bars indicate values that are significant differences (P<0.05) within a specific concentration (0, 0.05, 0.5, 5, 50 μg/L) of TDCIPP treatment and between different exposure time (7, 14, 28 days). The different upper-case above bars indicate values that are significant differences (P<0.05) within a specific exposure time (7, 14, 28 days) of TDCIPP treatment and between different concentration of TDCIPP treatment (0, 0.05, 0.5, 5, 50 μg/L). |
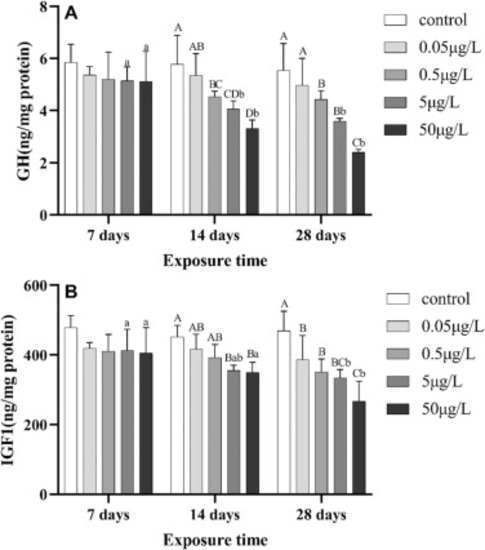
Fig. 2. Whole-body GH (A) and IGF1 (B) content in silver carp larvae exposed to different concentrations of TDCIPP for 7, 14 and 28 days. Values are the mean ± SD (n = 6). The different lower-case above bars indicate values that are significant differences (P<0.05) within a specific concentration (0, 0.05, 0.5, 5, 50 μg/L) of TDCIPP treatment and between different exposure time (7, 14, 28 days). The different upper-case above bars indicate values that are significant differences (P<0.05) within a specific exposure time (7, 14, 28 days) of TDCIPP treatment and between different concentration of TDCIPP treatment (0, 0.05, 0.5, 5, 50 μg/L). |
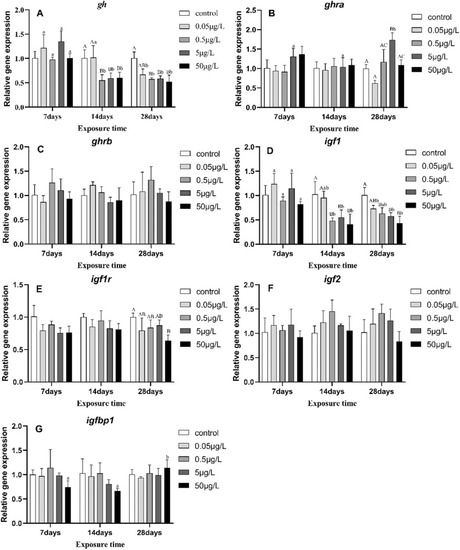
Fig. 3. Effects of TDCIPP on relative expression of genes involved in GH/IGF axis of silver carp larvae at 7, 14 and 28 days of exposure. Values are the mean ± SD (n = 6). The different lower-case above bars indicate values that are significant differences (P<0.05) within a specific concentration (0, 0.05, 0.5, 5, 50 μg/L) of TDCIPP treatment and between different exposure time (7, 14, 28 days). The different upper-case above bars indicate values that are significant differences (P<0.05) within a specific exposure time (7, 14, 28 days) of TDCIPP treatment and between different concentration of TDCIPP treatment (0, 0.05, 0.5, 5, 50 μg/L). |
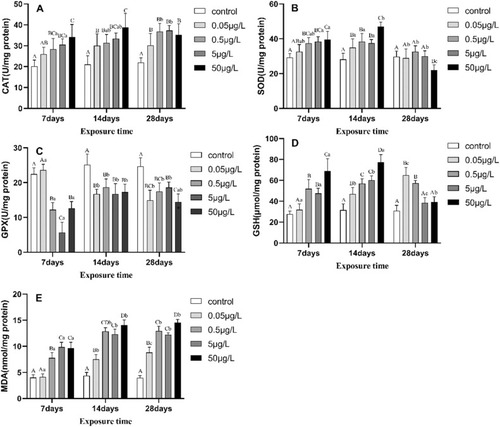
Fig. 4. Effects of TDCIPP on the antioxidative enzymes activity and MDA level of silver carp larvae at 7, 14 and 28 days. Values are the mean ± SD (n = 6). The different lower-case above bars indicate values that are significant differences (P<0.05) within a specific concentration (0, 0.05, 0.5, 5, 50 μg/L) of TDCIPP treatment and between different exposure time (7, 14, 28 days). The different upper-case above bars indicate values that are significant differences (P<0.05) within a specific exposure time (7, 14, 28 days) of TDCIPP treatment and between different concentration of TDCIPP treatment (0, 0.05, 0.5, 5, 50 μg/L). |
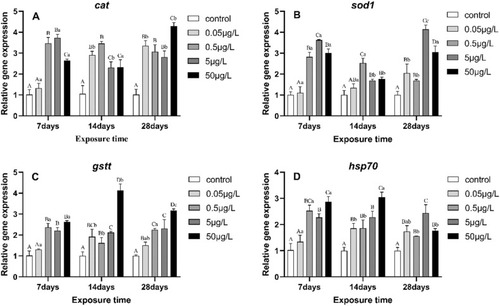
Fig. 5. Expression patterns of antioxidant-related genes of silver carp larvae at 7, 14 and 28 days. Values are the mean ± SD (n = 6). The different lower-case above bars indicate values that are significant differences (P<0.05) within a specific concentration (0, 0.05, 0.5, 5, 50 μg/L) of TDCIPP treatment and between different exposure time (7, 14, 28 days). The different upper-case above bars indicate values that are significant differences (P<0.05) within a specific exposure time (7, 14, 28 days) of TDCIPP treatment and between different concentration of TDCIPP treatment (0, 0.05, 0.5, 5, 50 μg/L). |