
|
Fig. 1
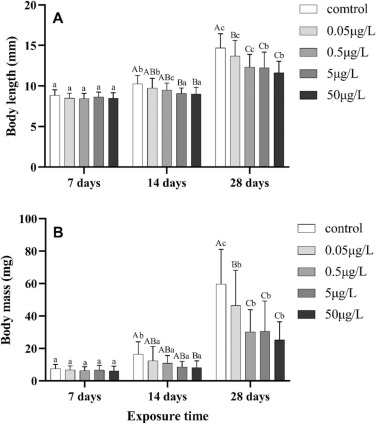
Fig. 1. Effects on body length (A) and body mass (B) of silver carp larvae exposed to different concentrations of TDCIPP at 7, 14 and 28 days. Values are the mean ± SD (n = 30). The different lower-case above bars indicate values that are significant differences (P<0.05) within a specific concentration (0, 0.05, 0.5, 5, 50 μg/L) of TDCIPP treatment and between different exposure time (7, 14, 28 days). The different upper-case above bars indicate values that are significant differences (P<0.05) within a specific exposure time (7, 14, 28 days) of TDCIPP treatment and between different concentration of TDCIPP treatment (0, 0.05, 0.5, 5, 50 μg/L).