
- Title
-
Fluid mechanics of the zebrafish embryonic heart trabeculation
- Authors
- Cairelli, A.G., Chow, R.W., Vermot, J., Yap, C.H.
- Source
- Full text @ PLoS Comput. Biol.

Fig 1. Microscope images and anatomic 3D models of the developing zebrafish endocardium. (A,D) Raw microscope images of (A) the whole ventricle, and (D) a single intra-trabecular space at 25%, 50% and 75% of the cardiac cycle. (B, E) Segmentation of (B) the ventricle and (E) a single intra-trabecular space, superimposed on the raw images, at the same time points as (A) and (D) (also shown in S1 Movie). The 3D reconstructed volumes are in red, while the regions of the 3D reconstruction close to the plane of the shown image are plotted in cyan on single 2D slice extracted from 4D image stacks of a zebrafish embryo from the Tg(fli1a:Gal4ff;UAS:EGFP-CAAX) line at 3 dpf. (C) Schematization of the intra-trabecular geometry, adapted from [15]. A, atrium; V, ventricle; ITS, intra-trabecular space. Here, t denotes time, while T denotes cardiac cycle duration. |
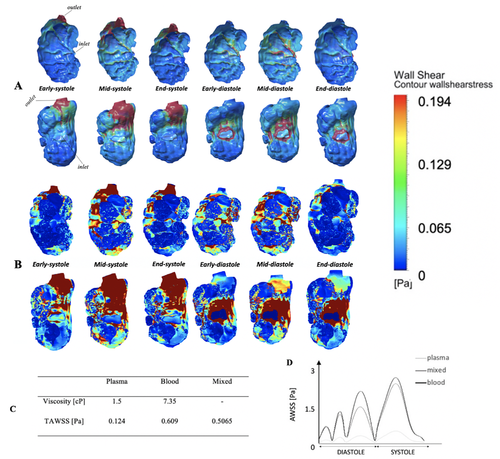
Fig 2. Endocardial WSS profiles compared at different cardiac phases, with plasma viscosity and with the mixed-viscosity. (A) Contour maps of endocardial WSS in a representative embryonic ventricle, over the cardiac cycle, with the assumption that fluid has the viscosity of plasma (1.5cP). Top row: ventral view of the outer curvature of the ventricle; bottom row: dorsal view of the inner curvature. (B) The same contour map of WSS, but for the mixed-viscosity assumption, where WSS results for plasma viscosity were adopted in the intra-trabecular spaces, but WSS results for whole blood viscosity were adopted for the trabeculation ridges. This scenario is generated considering that red blood cells do not enter the narrow intra-trabecular spaces often. (C) Time-averaged WSS over the ventricular surface calculated in simulations where the fluid viscosity was assumed to be that of plasma, blood, or mixed. (D) Temporal waveform of WSS averaged over the entire ventricular surface for the three scenarios. |

Fig 3. Comparison of area-averaged WSS, time- and area-averaged WSS and OSI for the ridges and grooves. (A, B) A typical intra-trabecular space (red) and the neighboring trabeculation ridge (blue) used for the WSS quantification and comparison. (C) Mean and standard deviation of the time-averaged WSS (TAWSS) and OSI (n = 4) with the mixed-viscosity assumption (viscosity of plasma for intra-trabecular spaces and the viscosity of blood for trabeculation ridges). Wilcoxon signed-rank test showed the lowest possible significance with the sample size (n = 4), p = 0.0625. (D) Temporal variation of WSS on a single ridge and groove under the same assumption. |

Fig 4. Endocardial WSS for a single intra-trabecular space, or groove, under the various scenarios considered. (A) Velocity vectors in a simulation conducted with the individual intra-trabecular space (orange arrow) joined to the main ventricular chamber for a 3 dpf zebrafish embryonic ventricle, which is the “Baseline” scenario in B. (B) Contour maps of the end-systolic WSS of the single intra-trabecular space under the different scenarios. In the “No Ventricle” scenario, the ventricular main chamber was detached from the intra-trabecular space, and replaced with a zero-reference pressure boundary condition. In the “No Ventricle, No Deformation” scenario, deformational motions, due to the contraction, were further removed from the “No Ventricle” scenario, but not the full translational motions. In the “No Ventricle, No Translation” scenario, translational motions were further removed from the “No Ventricle scenario”, but not the deformational motions. (C) Mean and standard deviation of the WSS (n = 6) for each scenario, calculated by averaging both spatially (over entire endocardial surface) and temporally (over entire cardiac cycle). * p<0.05. |

Fig 5. Effect of trapped fli1+/gata1+ cells on the endocardial WSS. (A) Confocal image of a 3 dpf zebrafish embryonic heart that was crossed between the Tg(fli1a:Gal4ff;UAS:EGFP-CAAX) line and the Tg(gata1:DsRed) line. (B) Close up of the image showing several wobbling cells appear to be trapped within intra-trabecular spaces from the image. Some of these cells were fli1+ (blue arrows), while some were gata1+/fli1+ (red arrows). These were thus hypothesized to be developing hematopoietic cells. (C) Flow simulation WSS results with and without the hematopoietic cells at end-systole, demonstrating that the cells elevated endocardial WSS. (D) Average WSS magnitude (n = 2) from the simulations, calculated by averaging both spatially (over entire endocardial surface) and temporally (over entire cardiac cycle). |
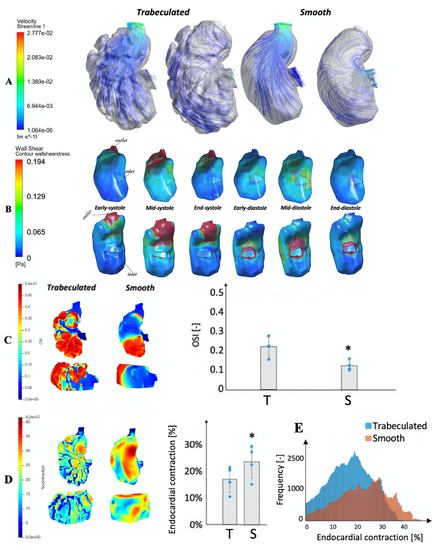
Fig 6. Comparison of hemodynamic parameters between traeculated and smooth embryonic ventricles. (A) Velocity streamlines for both trabeculated and smoothed wall simulations of a 3dpf zebrafish embryonic heart from lateral views, at (left) the end-diastolic phase and (right) the mid-systolic phase. (B) Contour maps of endocardial WSS in the same embryonic ventricle of Fig 2, but with a totally smooth geometry, over the cardiac cycle with the assumption that fluid has the viscosity of plasma (1.5cP). Top row: ventral view of the outer curvature of the ventricle; bottom row: dorsal view of the inner curvature (C) Spatial pattern and surface-averaged magnitudes of oscillatory shear index (OSI) for both trabeculated (T) and smoothed (S) wall simulations of a 3dpf zebrafish embryonic heart, from lateral and ventral views. (D) Spatial pattern and surface averaged-magnitudes of endocardial contractile surface area strains (end-diastole to end-systole), for both the trabeculated (T) and smoothed (S) simulations, from the same views. (E) Histograms of the endocardial contraction across surface locations for the trabeculated and smooth models of the same ventricular chamber.* p values were found to be at the minimum possible with the small sample size (n = 4, p = 0.0625). |