
|
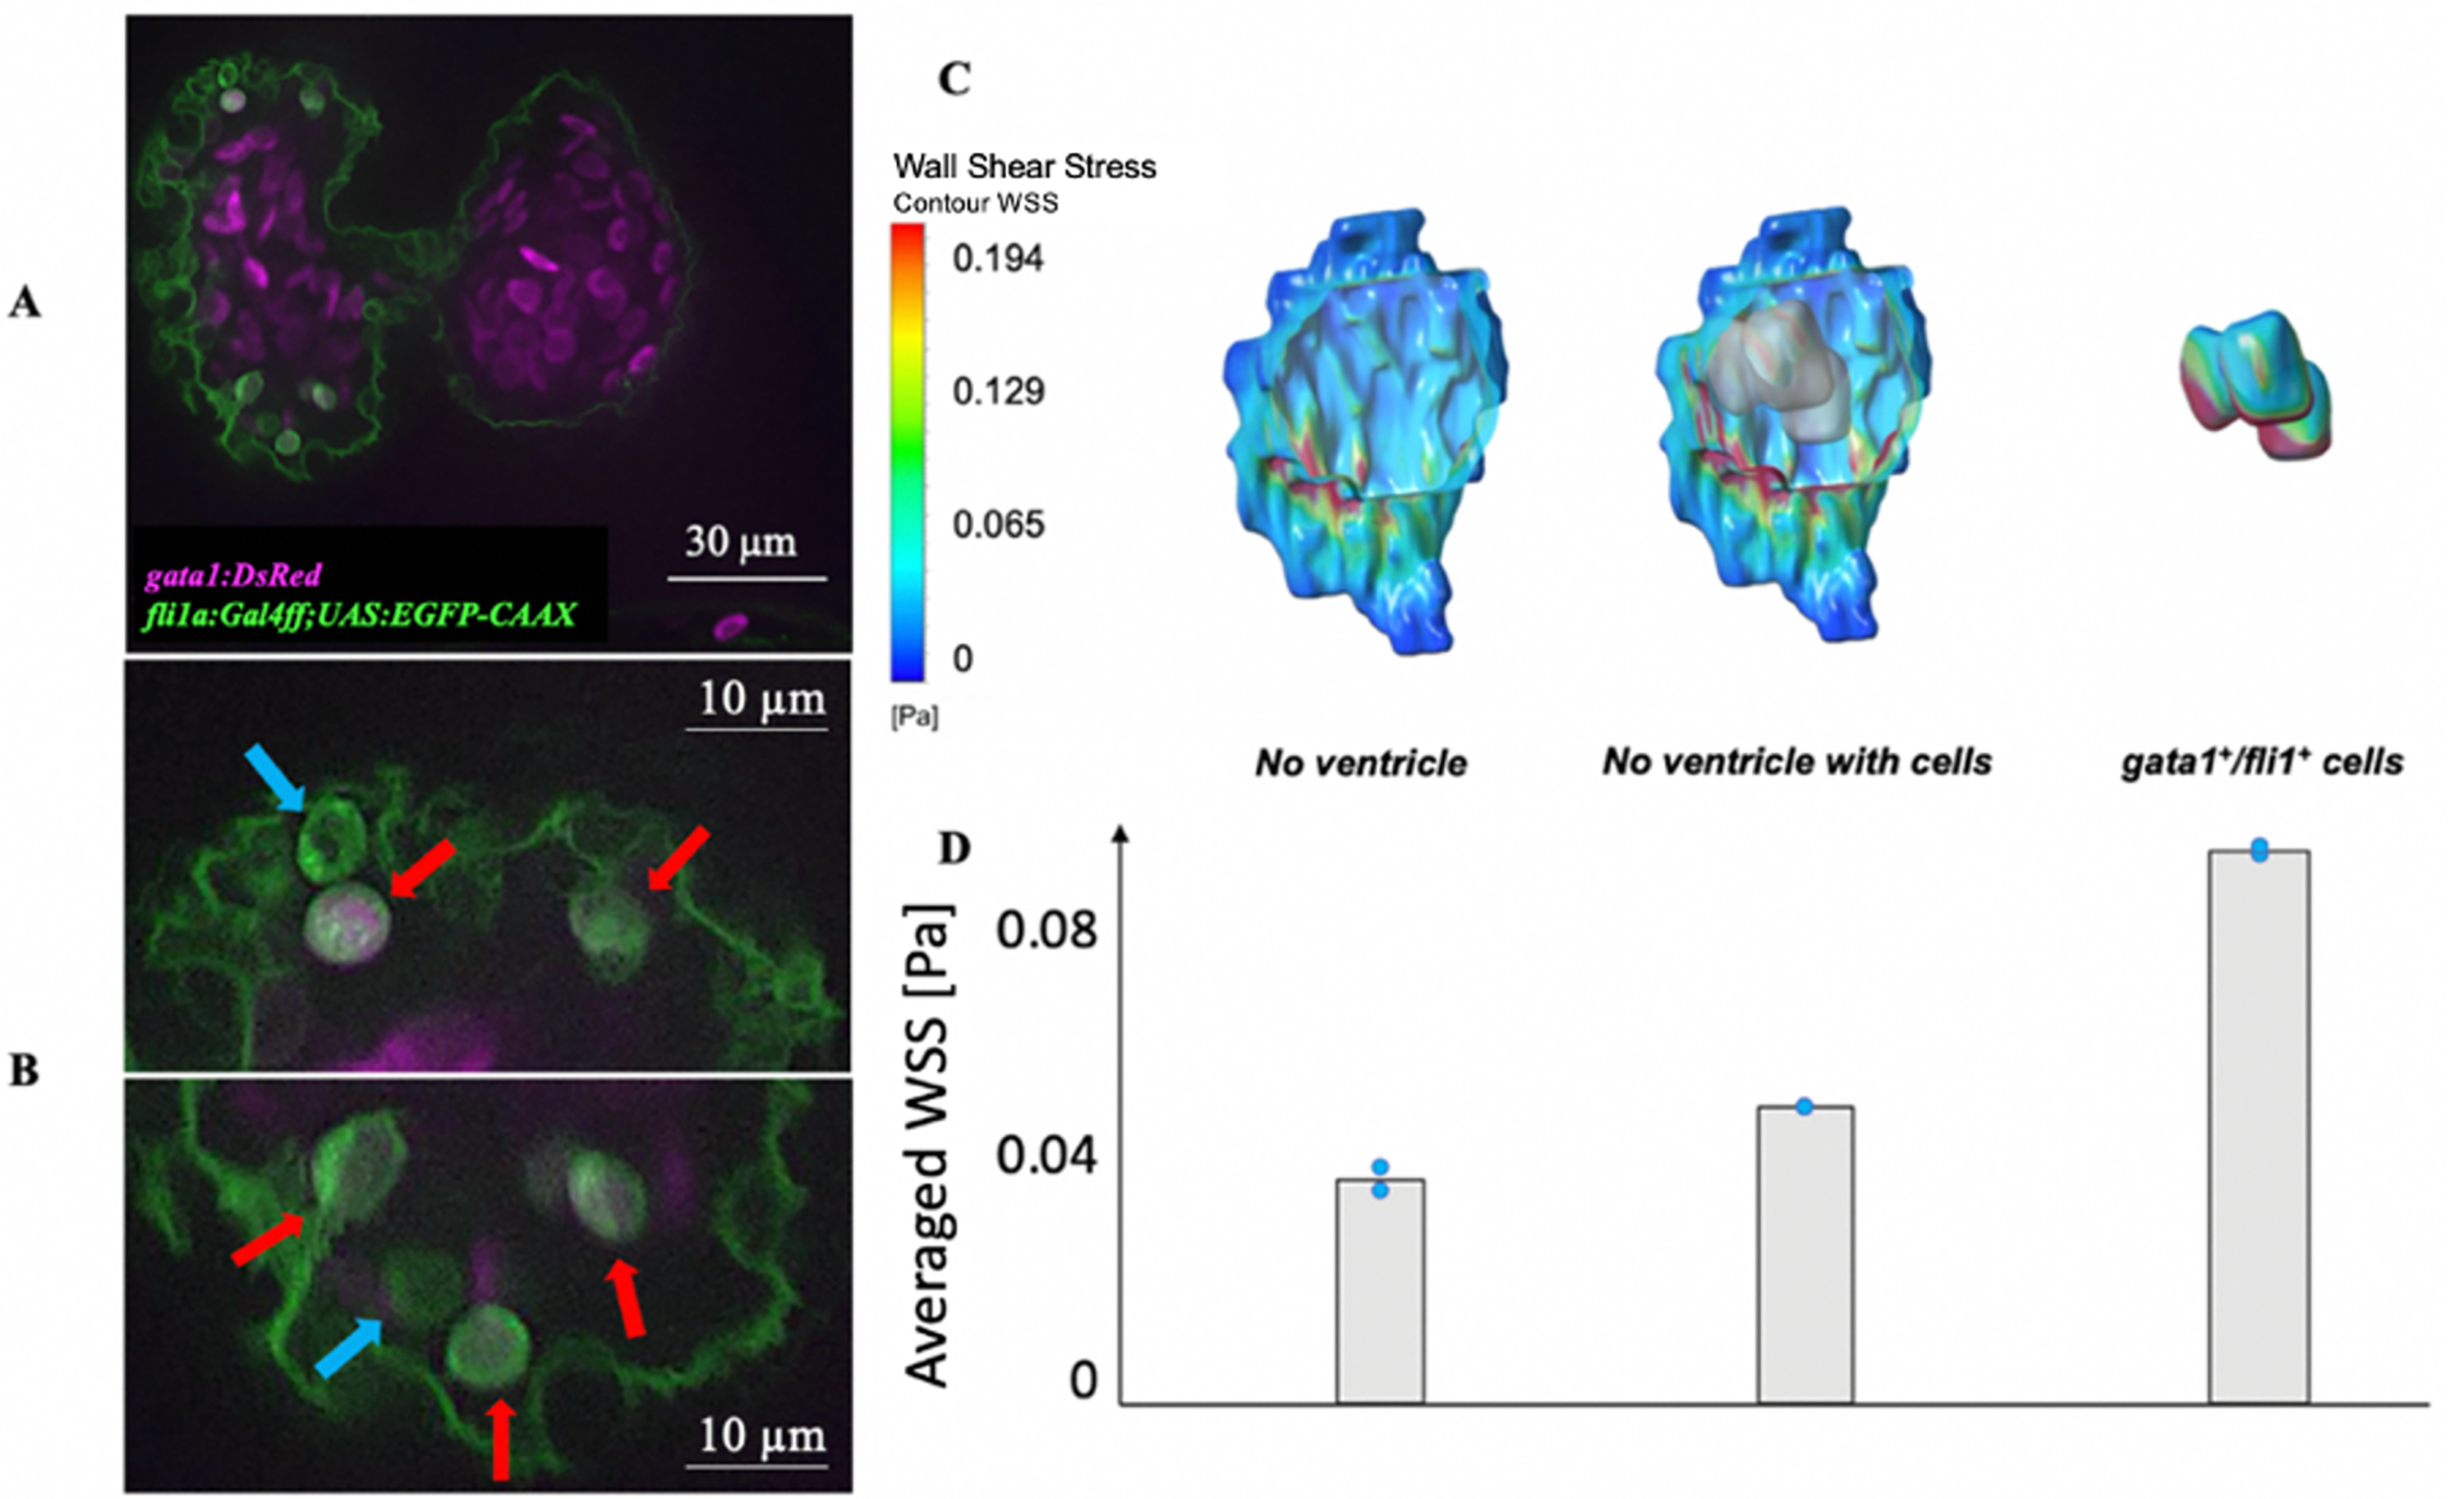
Fig. 5
(A) Confocal image of a 3 dpf zebrafish embryonic heart that was crossed between the Tg(fli1a:Gal4ff;UAS:EGFP-CAAX) line and the Tg(gata1:DsRed) line. (B) Close up of the image showing several wobbling cells appear to be trapped within intra-trabecular spaces from the image. Some of these cells were fli1+ (blue arrows), while some were gata1+/fli1+ (red arrows). These were thus hypothesized to be developing hematopoietic cells. (C) Flow simulation WSS results with and without the hematopoietic cells at end-systole, demonstrating that the cells elevated endocardial WSS. (D) Average WSS magnitude (n = 2) from the simulations, calculated by averaging both spatially (over entire endocardial surface) and temporally (over entire cardiac cycle).