
- Title
-
Functional Study of TMEM163 Gene Variants Associated with Hypomyelination Leukodystrophy
- Authors
- Yan, H., Yang, S., Hou, Y., Ali, S., Escobar, A., Gao, K., Duan, R., Kubisiak, T., Wang, J., Zhang, Y., Xiao, J., Jiang, Y., Zhang, T., Wu, Y., Burmeister, M., Wang, Q., Cuajungco, M.P., Wang, J.
- Source
- Full text @ Cells

ZFIN is incorporating published figure images and captions as part of an ongoing project. Figures from some publications have not yet been curated, or are not available for display because of copyright restrictions. |
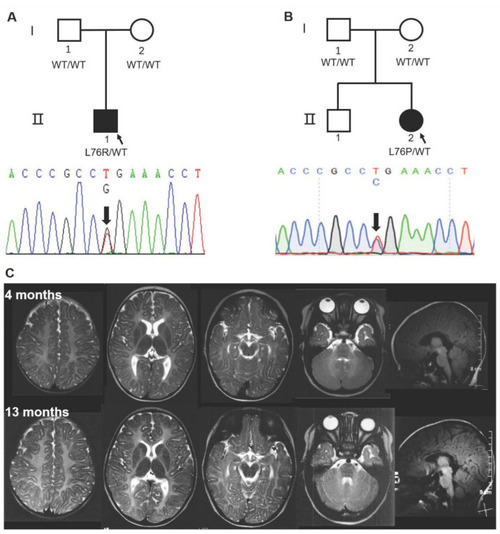
Figure 1. Sanger sequencing of two HLD pedigrees and representative MRI of Patient 2 with the TMEM163-L76P mutation. (A,B) De novo heterozygous c.227T>G p.(L76R) and c.227T>C p.(L76P) in TMEM163 was identified in two probands, respectively. I, parents; II, progeny. (C) Diffuse hypo-intense signal on T2-weighted images at 4 months and 13 months indicated hypomyelination in cerebral white matter (C). WT, wild type.
|
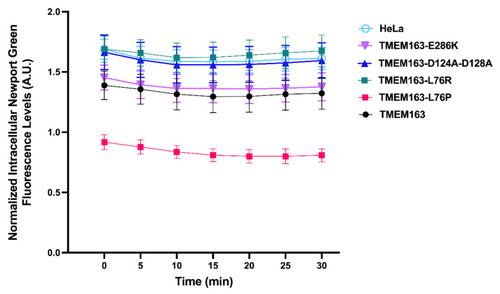
Figure 2. Intracellular zinc flux assay of HeLa cells stably expressing wild-type and variant TMEM163 proteins. The HLD-linked variant TMEM163-L76P showed significantly enhanced zinc efflux, while the TMEM163-L76R variant displayed marked loss of zinc efflux activity that mimicked the inactive TMEM163-D124A-D128A mutant. Unmodified HeLa cells and stable cells expressing the TMEM163-E286K mutant were included as additional controls. Significance testing was performed using ANOVA with repeated measures followed by a post-hoc analysis using Tukey’s multiple comparisons test (p < 0.0001, n = 4 independent trials). Data are represented as means ± SEM. A.U., arbitrary unit.
|
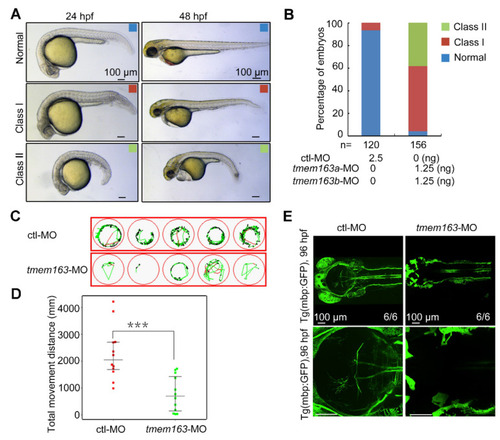
Figure 3. Impact of tmem163 knockdown on morphology, locomotor ability and myelination in zebrafish larvae: (A) Representative images of the normal (blue), mild (red), and severe (green) phenotypes observed in the control and tmem163-MO injected groups at 24 hpf and 48 hpf. Scale bar: 100 μm. (B) Quantification of the percentage of normal, class I, and class II in two groups obtained. The percentages of embryos with each phenotype are shown in the bar graphs, and the number of embryos examined is listed under each bar. (C) Examples of swimming tracks of five single larvae of each condition shown in green at 120 hpf. (D) Scatter plot displaying the total movement distance by different larvae: MO-control (n = 12): 2689 ± 477 mm; tmem163-MO (n = 12): 748 ± 200 mm. *** p < 0.01 (Student’s t-test). (E) Representative pictures of the Tg(mbp:GFP) larvae injected with control and tmem163-MO at 96 hpf (dorsal views with anterior to the left). Scale bar: 100 μm.
|
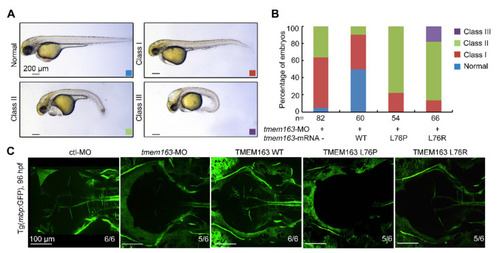
Figure 4. Functional analysis of TMEM163 mutations in zebrafish injected with translation-blocking morpholinos: (A) Representative images of the normal (blue), mild (red), severe (green) and profound (purple) phenotypes observed in the tmem163-MO, MO+TMEM163 WT, MO+TMEM163 L76P, MO+TMEM163 L76R injected groups at 48 hpf. Scale bar: 200 μm. (B) Percentage of living embryos showing any phenotype at 48 hpf. Co-injection of tmem163-MO with a human wild-type TMEM163 mRNA partially rescued phenotypes of tmem163 morphants such as degeneration of CNS, hydrocephalus, and bent tails, whereas injection of TMEM163 mRNA bearing the p.L76P or p.L76R mutation failed to rescue the phenotype. The number of embryos examined is listed under each bar. (C) The myelination in CNS is disrupted. Illustration of the Tg(mbp:GFP) larvae injected with control-MO, tmem163-MO, TMEM163 WT, TMEM163 L76P, TMEM163 L76R at 96 hpf (dorsal views with anterior to the left). Both the mutations disorganize the myelin in the brain. The ratios of affected embryos are indicated. Scale bar: 100 μm.
|
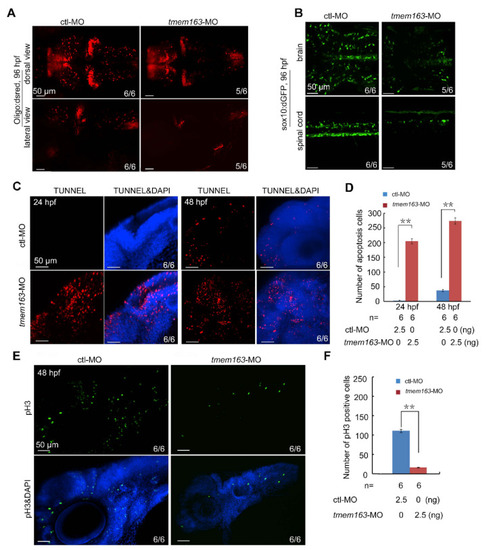
Figure 5. Loss of tmem163 leads to reduction of oligodendrocytes: (A) Fluorescent express pattern of oligo2:DsRed in larvae injected with control and tmem163-MO at 96 hpf (anterior to the left). The ratio of embryos with representative morphology was shown in the right corner of each picture. Scale bar: 50 μm. (B) Fluorescent express pattern of sox10:GFP in larvae injected with control and tmem163-MO at 96 hpf (anterior to the left). The ratios of affected embryos are indicated. Scale bar: 50 μm. (C) TUNNEL assay in embryos injected with control and tmem163-MO at 24 hpf and 48 hpf. Lateral views with the dorsal side pointing to the top. The ratios of affected embryos are indicated. Note the distinct increase in tmem163 morphants at the indicated stages. Scale bar: 50 μm. (D) Quantification of apoptosis cells (TUNEL-positive cells) in the hindbrain region calculated from six embryos. ** p < 0.01 (Student’s t-test). (E) Cell proliferation in tmem163 morphants is impaired as revealed by immunofluorescent stained with anti-phosphorylated H3 antibody (green) and DAPI (blue). The ratio of embryos with representative signals was shown in the right corner of each picture. Scale bar: 50 μm. (F) Quantification of proliferative cells (GFP-positive cells) in the hindbrain region calculated from six embryos. ** p < 0.01 (Student’s t-test).
|