
- Title
-
A Multi-Site Assessment of Anesthetic Overdose, Hypothermic Shock, and Electrical Stunning as Methods of Euthanasia for Zebrafish (Danio rerio) Embryos and Larvae
- Authors
- Mocho, J.P., Lang, F., Valentin, G., Bedu, S., McKimm, R., Ramos, J., Saavedra Torres, Y., Wheatley, S.E., Higgins, J., Millington, M.E., Lundegaard, P.R., Chamorro Valverde, R., Jenčič, V., von Krogh, K.
- Source
- Full text @ Biology (Basel)
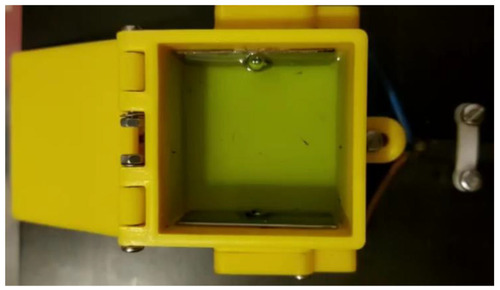
Figure 1. EFS-Wasp1 (Fish Management Systems Ltd., Carrickfergus, U.K.) chamber for electrical stunning with larvae (Danio rerio) in embryo media.
|

Figure 2. Results for zebrafish embryo and larva euthanasia, presented per experimental dish (results from <12 h post fertilization, 24 h post fertilization, and 4 days post fertilization pooled, n = 20–202). The dishes in which treatments lead to no surviving embryo or larva were scored as “passed” (green), whereas the dishes with one-or-more surviving embryos or larvae were scored as “failed” (red). For the results per individual time point, see Table 4.
|
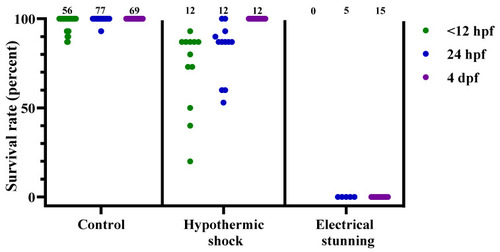
Figure 3. Survival rates for zebrafish following the control treatment, hypothermic shock, or electrical stunning, at 3 different developmental stages (<12 hpf, 24 hpf, and 4 dpf), presented as result per dish. Each dot represents one dish, with the total number of dishes per group indicated at the top of each column (n = 0–77). hpf; hours post fertilization. dpf; days post fertilization.
|
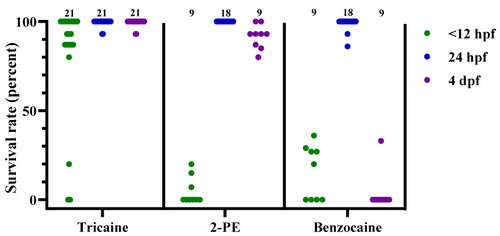
Figure 4. Survival rates for zebrafish following tricaine, 2-phenoxyethanol (2-PE), or benzocaine treatment, at 3 different developmental stages (<12 hpf, 24 hpf, and 4 dpf), presented as result per dish. Each dot represents one dish, with the total number of dishes per group indicated at the top of each column (n = 9–21). hpf; hours post fertilization. dpf; days post fertilization.
|
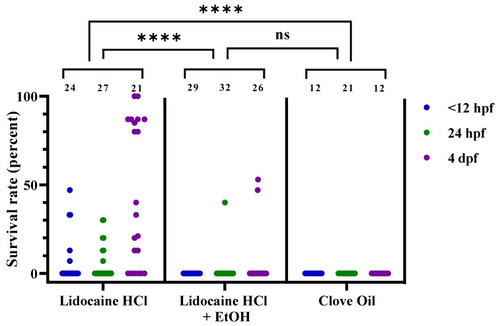
Figure 5. Survival rates for zebrafish following lidocaine hydrochloride (HCl), lidocaine HCl with ethanol (EtOH), or clove oil treatment, at 3 different developmental stages (<12 hpf, 24 hpf, and 4 dpf), presented as result per dish. Each dot represents one dish, with the total number of dishes per group indicated at the top of each column (n = 12–32). Statistical difference between the treatments was assessed by the chi-squared test (p < 0.0001), with post hoc analysis using Fisher’s exact test; ****; p < 0.0001. Note that the statistical analyses were performed on passed/failed dish frequencies (see Table 4 for details) and not on the continuous data presented here. ns; no statistical significance (p = 0.2987). hpf; hours post fertilization. dpf; days post fertilization.
|
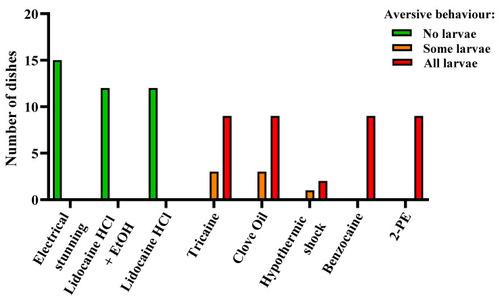
Figure 6. Aversive behavior in zebrafish larvae (4 days post fertilization) during electrical stunning, anesthetic overdose, and hypothermic shock, presented as result per dish. Each experimental dish (n = 3–15 per treatment) contained 10–15 larvae. Dishes were scored as “No larvae”, “Some larvae”, or “All larvae” depending on the proportion of the larvae displaying aversive behavior.
|