
Image
|
Figure Caption
Figure 3
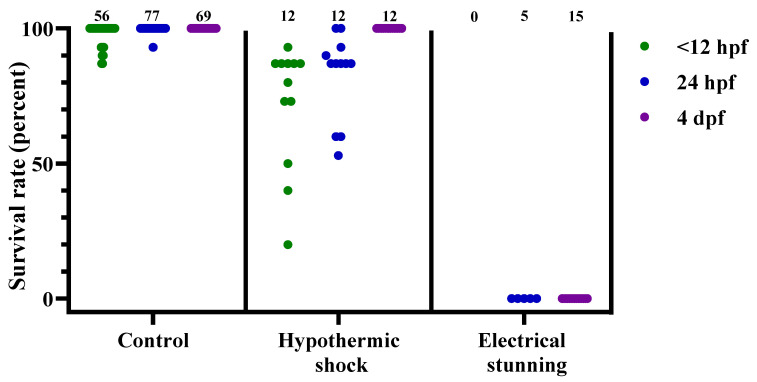
Figure 3. Survival rates for zebrafish following the control treatment, hypothermic shock, or electrical stunning, at 3 different developmental stages (<12 hpf, 24 hpf, and 4 dpf), presented as result per dish. Each dot represents one dish, with the total number of dishes per group indicated at the top of each column (n = 0–77). hpf; hours post fertilization. dpf; days post fertilization.
Acknowledgments
This image is the copyrighted work of the attributed author or publisher, and
ZFIN has permission only to display this image to its users.
Additional permissions should be obtained from the applicable author or publisher of the image.
Full text @ Biology (Basel)