
- Title
-
The evolutionarily conserved miRNA-137 targets the neuropeptide hypocretin/orexin and modulates the wake to sleep ratio
- Authors
- Holm, A., Possovre, M.L., Bandarabadi, M., Moseholm, K.F., Justinussen, J.L., Bozic, I., Lemcke, R., Arribat, Y., Amati, F., Silahtaroglu, A., Juventin, M., Adamantidis, A., Tafti, M., Kornum, B.R.
- Source
- Full text @ Proc. Natl. Acad. Sci. USA
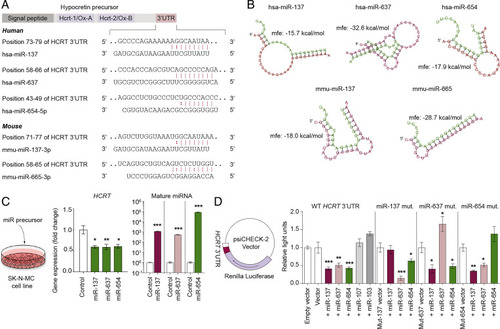
Identification, characterization, and conservation of miRNAs targeting HCRT. (A) In silico prediction of HCRT-targeting miRNAs (from the miRNA bodymap). hsa-miR-137, hsa-miR-637, and hsa-miR-654-5p were predicted to target human HCRT. mmu-miR-137-3p and mmu-miR-665-3p were predicted to target Hcrt in mice. (B) Thermodynamic energy prediction for the association of human HCRT 3′-UTR or mouse Hcrt 3′-UTR with the predicted miRNAs. Green: miRNAs; red: Human HCRT/mouse Hcrt sequence. (C) Effect on HCRT levels following overexpression of precursor hsa-miR-137 (n = 5), hsa-miR-637 (n = 6), hsa-miR-654-5p (n = 3), or scrambled miRNA control (n = 8) in the human neuroblastoma cell line SK-N-MC. RNA levels are presented as the magnitude of difference from the control ± SEM; *P < 0.05; **P < 0.01; one-way ANOVA with Dunnett’s post hoc test. The mature miRNA level was quantified in the same cells and are presented as fold change compared to control ± SEM ***P < 0.001, two-tailed Student’s t test for each independent experiment as marked with vertical lines. (D) Direct miRNA-mediated downregulation of the luciferase signal with the 3′-UTR of HCRT cloned into the psicheck-2 luciferase vector. The vector and miRNAs were cotransfected into HEK-293 cells. miR-107 and miR-103 were used as negative controls as these do not target HCRT. Mutation of miR-137-seed site:mut-137, mutation of miR-637-seed site:mut-637, and mutation of miR-654-5p-seed site:mut-654. Data were normalized to the control vector in each experiment ± SEM (n = 5/condition). *P < 0.05; **P < 0.01; ***P < 0.001; four separate one-way ANOVA with Dunnett’s post hoc tests are used compared to the control groups vector, Mut-137 vector, Mut-637 vector, or Mut-654 vector. The four experiments are separated by vertical lines. |
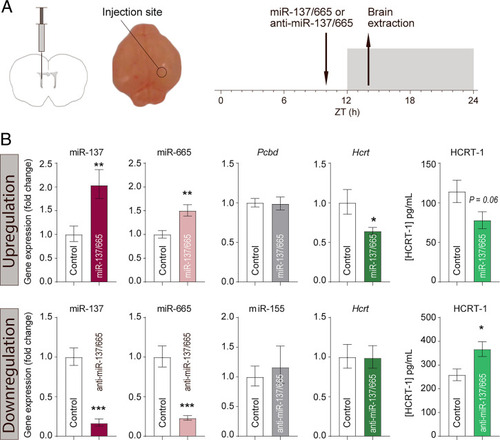
In vivo targeting of Hcrt by miR-137-3p and miR-665-3p. (A) Schematic representation of ICV injection in P4 mouse pups. (B) Injection of a mixture of mmu-miR-137-3p/miR-665-3p mimics (n = 9) and anti-miR-137-3p/anti-miR-665-3p (n = 7) in P4 pups. Littermate controls were injected with a scramble (n = 16 per group) or an antiscramble (n = 15). RNA was isolated and analyzed by qRT-PCR. Data are presented as the magnitude of the difference compared with controls ± SEM. HCRT-1 peptide was extracted from the brains and analyzed by radioimmunoassay (RIA) (upregulation by miRNA mimic, n = 8 vs. controls n = 7; downregulation by anti-miR, n = 15 vs. controls n = 7). Counts are normalized to control and presented as mean ± SEM. Pcbd: Pterin-4-alpha-carbinolamine dehydratase function as the control since it is not a target of mmu-miR-137-3p/miR-665-3p. miR-155 is included as a control to illustrate that miRNAs in general are not affected by anti-miR injections. *P < 0.05; **P < 0 0.01; ***P < 0.001, two-tailed Student’s t test. |
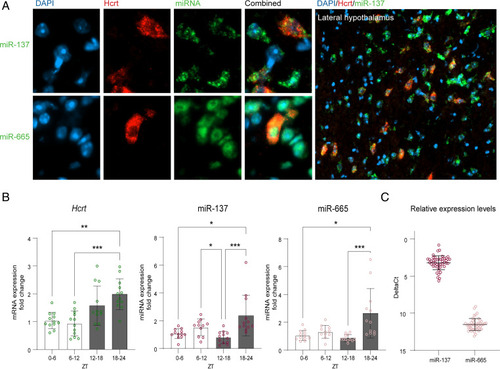
Correlation between hypocretin expression and miRNA diurnal variations. (A) Single neurons from mouse brain sections that were immunostained with HCRT-specific antibody (red) following in situ hybridization with LNA-mmu-miR-137-3p or LNA-mmu-miR-665-3p-specific probes (green). Upper Right shows colocalization of mmu-miR-137-3p with Hcrt-positive cells in the lateral hypothalamus of the mouse brain. All detected Hcrt neurons coexpressed miR-137. (B) Expression of miR-137, miR-665, and Hcrt mRNA in the mouse hypothalamus at different zeitgeber time intervals (ZTs). The gray bars represent the dark phase; n = 12/group animals at each time interval. Data were analyzed with the nonparametric Kruskal–Wallis test followed by Dunn’s multiple comparisons of all time points compared to all other time points *P < 0.05; **P < 0.01; ***P < 0.001. (C) Relative expression levels of miR-137 and miR-665 in the hypothalamus. DeltaCt is the difference between the level of two endogenous control genes U6 and SNO202 as measured by qRT-PCR and the miR level. High deltaCt equals a low expression level, and therefore, we depict the y axis in reverse. n = 48/group. |
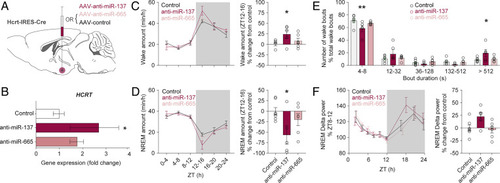
Targeted downregulation of miR-137 in Hcrt neurons consolidates wakefulness. (A) Schematic representation of local injection of AAVs in the lateral hypothalamus of Hcrt:IRES-Cre driver mice. (B) Expression levels of Hcrt in murine brain after rAAV-anti-miR-137, rAAV-anti-miR-665, and rAAV-anti-miR-128 overexpression, specifically in the Hcrt-producing neurons. rAAV-anti-miR-128 was used as a control, as it does not target Hcrt. Mice were euthanized at 5 wk postinjection. Differences between the anti-miR and control groups were analyzed using a one-way ANOVA with Dunnett’s post hoc test. *P = 0.039. (n: control = 5; anti-miR-137 = 5; anti-miR-665 = 6 animals). (C and D) Quantification of vigilance states per 4-h intervals over 24 h. Local expression of anti-miR-137 in Hcrt neurons increases wakefulness (C) and accordingly decreases NREM sleep (D), compared with control mice during the first 4 h of the dark period (ZT12-16). There is a significant increase of 24.1 ± 9.9% in the duration of wakefulness and a reduction of 56.4 ± 22.3% in that of NREM sleep, in anti-miR-137-injected animals during ZT12-16 (anti-miR-137 vs. control: *P < 0.05 for wakefulness and NREM; anti-miR-665 vs. control: P > 0.05 for wakefulness and NREM; one-way ANOVA with Dunnett’s post hoc test. n: control = 7; anti-miR-137 = 5; anti-miR-665 = 6 animals). (E) Distribution of wakefulness bout durations shows significantly longer bouts in anti-miR-137–injected animals compared with controls during ZT12-16 (anti-miR-137 vs. control: **P < 0.01 for 4- to 8-s bouts of wakefulness; *P < 0.05 for >512-s bouts; two-way ANOVA with Dunnett’s post hoc test. n: control = 7; anti-miR-137 = 5; anti-miR-665 = 6 animals). (F) Dynamics of NREM delta (0.75 to 4 Hz) power over 24 h indicates a tendency that anti-miR-137–injected animals have higher EEG delta power (22.8 ± 8.5) in the first percentile of NREM sleep during the dark period compared with controls (anti-miR-137 vs. control: P = 0.063; anti-miR-665 vs. control: P > 0.05; one-way ANOVA with Dunnett’s post hoc test. n: control = 7; anti-miR-137 = 5; anti-miR-665 = 6 animals). |
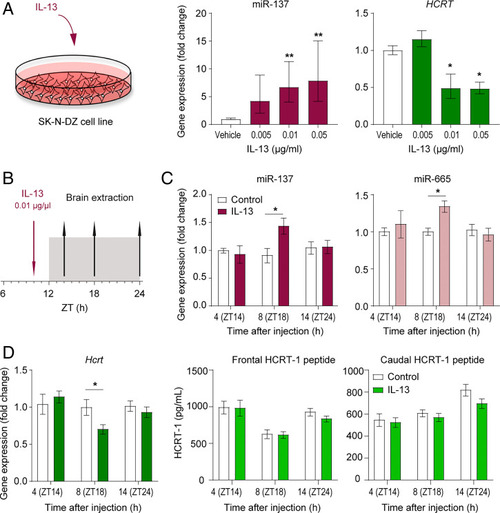
IL-13 induces miR-137 upregulation and HCRT downregulation in vitro and in vivo. (A) Stimulation of human neuroblastoma cells (SK-N-DZ) with IL-13 at concentrations of 0.005 ng/µL (n = 9), 0.01 ng/µL (n = 15), and 0.05 ng/µL (n = 12). RNA was isolated and miR-137 and HCRT expression analyzed by qRT-PCR. Data are from seven independent cell culture experiments and presented as the mean fold change difference compared with vehicle ± SEM (one-way ANOVA with Dunnett’s post hoc test comparing to vehicle group; *P < 0.05; **P < 0.01). (B) Schematic overview of IL-13 injection (0.01 µg/µL, intraperitoneal) and timing of termination. (C) Expression analysis of mmu-miR-137 (ZT18 control vs. IL-13 injection; n = 10 and 11, respectively) and mmu-miR-665 (ZT18 control vs. IL-13 injection; n = 9 and 11, respectively). Data are presented as the magnitude of difference compared with vehicle ± SEM (two-way ANOVA with Sidak post hoc comparisons of treatment group to control group at each time point; *P < 0.05). (D) HCRT mRNA determined by qRT-PCR and HCRT-1 peptide levels determined by RIA. ZT18 control vs. IL-13 injection; n = 10 and n = 11, respectively. Data are presented as mean ± SEM (two-way ANOVA with Sidak post hoc comparisons of treatment group to control group at each time point; *P < 0.05). |
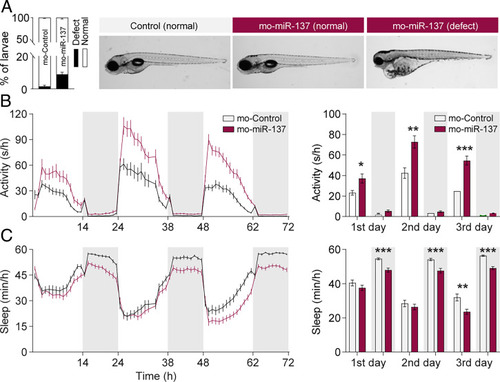
Knockdown of miR-137 increases locomotor activity and reduces sleep in zebrafish. (A) Morphological evaluation of zebrafish after knocking down miR-137. The developmental deficit rate in 5-dpf larvae is less than 10% (Left, combined dataset from four independent experiments, Mo-miR-137: n = 223, Mo-control; n = 207 fish). Right shows representative morphological images of normal and abnormal fish (Right). (B) Time course of the locomotion activity 5 to 7 dpf (Right), and the average activity per 14 h:10 h light:dark cycle (Left). Mo-miR-137 fish are significantly more active during the light phase than Mo-controls (Mo-miR-137 vs. Mo-control: P < 0.05 for light 5 dpf; P < 0.01 for light 6 dpf; P < 0.001 for light 7 dpf; F = 13.76; DF = 5; two-way ANOVA with Sidak post hoc test; *P < 0.05; **P < 0.01; ***P < 0.001; representative figure with Mo-miR-137: n = 48, Mo-control; n = 48 fish). (C) Time course of the amount of sleep 5 to 7 dpf (Right), and the average amount of sleep per light/dark cycle (Left). Mo-miR-137 fish sleep significantly less during dark periods than Mo-controls (Mo-miR-137 vs. Mo-control: P < 0.001 for dark 5 to 7 dpf; P < 0.01 for light 7 dpf; F = 2.79; DF = 5; two-way ANOVA with Sidak post hoc test; representative figure with Mo-miR-137: n = 48, Mo-control: n = 48 fish). |
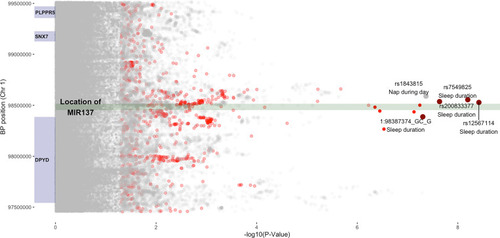
Genetic associations between sleep duration and the human MIR137 locus. Chromosome location of MIR137 with surrounding SNPs and genes. The plot depicts the location of MIR137 (dark-green box) on chromosome 1 (98453556 to 98515419 GRCh37/hg19). Genes in close genomic proximity (±1,000,000 base pairs) are marked with dark-blue boxes. The −log10-transformed values of P values for SNPs of 19 sleep phenotypes from the UK Biobank are plotted on the x axis. All genome-wide-significant SNPs with values of P ≤ 5E-8 are marked in dark red and annotated, whereas SNPs from the sleep duration GWAS with a P value between 5E-8 and 0.05 are indicated in light red. All other SNPs for different GWAS phenotypes are marked in gray. The size of the points increases with the significance of the SNP association. |