
- Title
-
Magnesium isoglycyrrhizinate attenuates acute alcohol-induced hepatic steatosis in a zebrafish model by regulating lipid metabolism and ER stress
- Authors
- Dai, W., Wang, K., Zhen, X., Huang, Z., Liu, L.
- Source
- Full text @ Nutr. Metab. (Lond).

MgIG ameliorate acute alcohol induced-hepatic steatosis in zebrafish Larvae. |
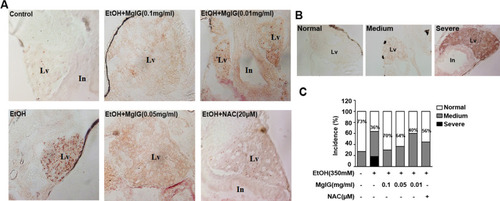
MgIG ameliorate acute alcohol induced-hepatic steatosis in zebrafish Larvae. |
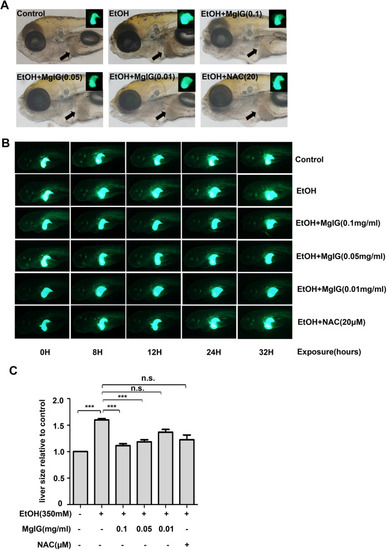
MgIG ameliorate acute alcohol induced-hepatomegaly in zebrafish Larvae. |
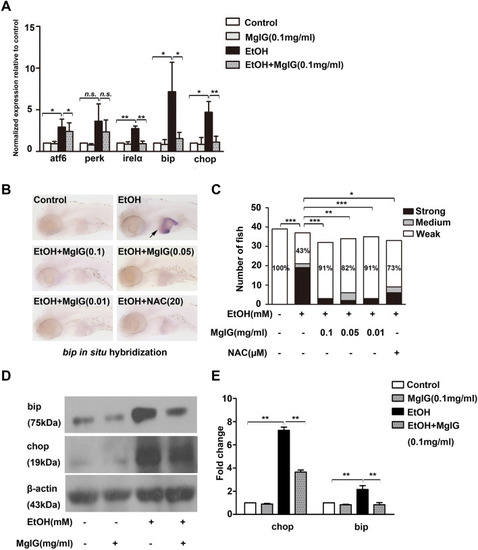
Effect of MgIG on alcohol-induced ER stress. a The relative atf6, perk, irelα, bip and chop mRNA expression was analyzed by qRT-PCR in the livers of larvae treated with 0% or 350 mM alcohol, 0.1 mg ml−1 MgIG, 350 mM alcohol + 0.1 mg ml−1 MgIG. *P < 0.05, **P < 0.01, n.s.: no significant difference, by one-way ANOVA. b The expression of bip was detected by whole-mount in situ hybridization. The typical pictures of each group were shown. c Quantification of bip expression is categorized “strong”, “medium”, or “weak”. Bar chart indicates the percentages of each category in each group, and the percentages of larvae in “weak” category is noted. *P < 0.05, **P < 0.01, ***P < 0.001, n.s.: no significant difference, by Chi-Square test. d and e Protein expression of bip and chop was examined by western blot in zebrafish larvae exposed to 0% or 350 mM alcohol, 0.1 mg ml−1 MgIG, or 350 mM alcohol + 0.1 mg ml−1 MgIG for 32 h, the degree of protein expression was normalized to β-actin. *P < 0.05, **P < 0.01, ***P < 0.001, by one-way ANOVA |
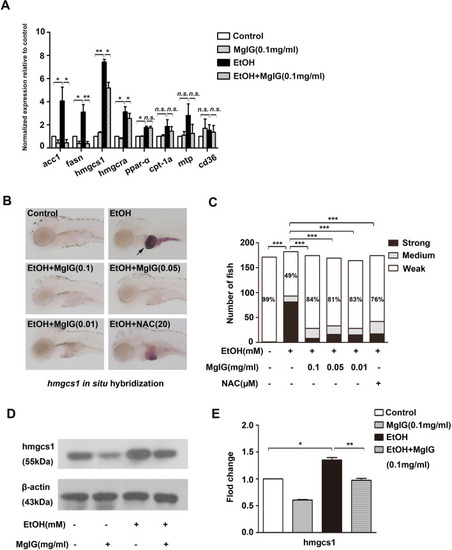
Effect of MgIG on alcohol-induced lipid metabolism dysfunction. a The relative acc1, fasn, hmgcs1, hmgcra, ppar-α, cpt-1, mtp, cd36 mRNA expression was analyzed by qRT-PCR in the livers of larvae treated with 0% or 350 mM alcohol, 0.1 mg ml−1 MgIG, or 350 mM alcohol + 0.1 mg ml−1 MgIG. *P < 0.05, **P < 0.01, ***P < 0.001, n.s.: no significant difference, by one-way ANOVA. b The expression of hmgcs1 was detected by whole-mount in situ hybridization. The typical pictures of each group were shown. c Quantification of hmgcs1 expression is categorized “strong”, “medium”, or “weak”. Bar chart indicates the percentages of each category in each group, and the percentages of larvae in “weak” category is noted. *P < 0.05, **P < 0.01, ***P < 0.001, n.s.: no significant difference, by Chi-Square test. d and e Protein expression of hmgcs1 was examined by western blot in larvae exposed to 0% or 350 mM alcohol, 0.1 mg ml−1 MgIG, or 350 mM alcohol + 0.1 mg ml−1 MgIG for 32 h, the degree of protein expression was normalized to β-actin. *P < 0.05, **P < 0.01, ***P < 0.001, by one-way ANOVA |