
- Title
-
Environmental enrichment decreases anxiety-like behavior in zebrafish larvae
- Authors
- Gatto, E., Dadda, M., Bruzzone, M., Chiarello, E., De Russi, G., Maschio, M.D., Bisazza, A., Lucon-Xiccato, T.
- Source
- Full text @ Dev Psychobiol
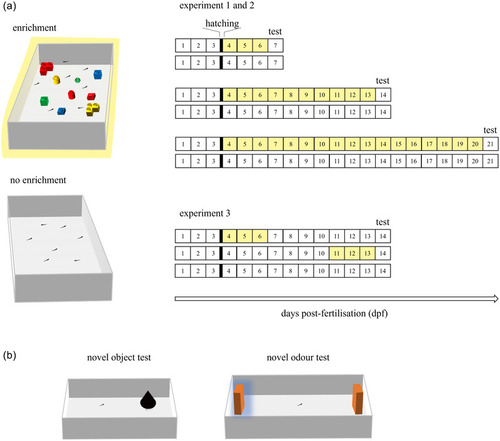
Schematic diagram of the experimental design. (a) Enrichment treatments. Zebrafish larvae were randomly assigned to either “enrichment” or “no enrichment” treatment. As enrichment, Lego® bricks of various color and shape were provided to increase environmental complexity. Larvae were individually tested at different age according to the experimental schedule. Experiment 1 aimed at investigating the subjects’ reaction to a novel visual stimulus at three different ages: 7, 14, and 21 dpf. Experiment 2 aimed at investigating the subjects’ reaction at 7, 14, and 21 dpf to a novel odor. Experiment 3 aimed at investigating the effect of environmental enrichment duration and timing on subject's reaction to a novel object stimulus in 14‐dpf larvae exposed either from 4 to 6 dpf or from 11 to 13 dpf or not exposed to enrichment. (b) Behavioural apparatuses. Novel object test of experiments 1 and 3 (left): larvae were free to interact with a novel object (i.e., a black cone place over a white pedestal). Novel odor test of experiment 2 (right): larvae were free to explore undisturbed the two stimuli. One stimulus was soaked with a solution of FishWater and olfactory cue (Benzaldehyde), while the other had no olfactory cue and was used as control |
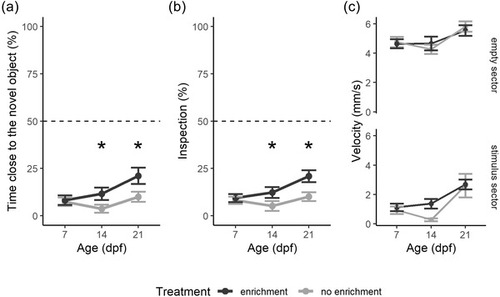
Neophobic response to novel object in 7‐, 14‐, and 21‐dpf larvae (experiment 1). (a) Percentage of time spent in the sector with the novel stimulus. (b) Percentage of inspections in the sector with the novel stimulus. (c) Swimming velocity in each sector. Subjects were divided for “enrichment” (dark gray) and “no enrichment” (light gray) treatment. Data points represented the mean ± standard error. Dotted lines represented the expected chance percentage (50%) |
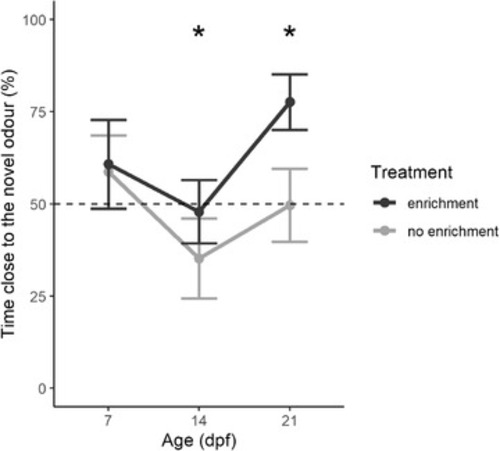
Neophobic response to novel odor in 7, 14, and 21 dpf (experiment 2). Percentage of time spent in the sector with the novel stimulus. Subjects were divided for “enrichment” (dark gray) and “no enrichment” (light gray) treatment. Data points represented the mean ± standard error. Dotted lines represented the expected chance percentage (50%) |
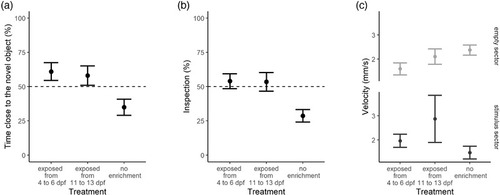
Neophobic response to novel object in 14‐dpf larvae of three treatments of experiment 3: exposed to objects from 4 to 6 dpf, exposed from 11 to 13 dpf, ‘no enrichment’ group. (a) Percentage of time spent in the sector with the novel stimulus. (b) Percentage of inspections in the sector with the novel stimulus. (c) Swimming velocity divided for the empty sector (light gray) and the sector contained the novel object (dark gray). Data points represented the mean ± standard error. Dotted lines represented the expected chance percentage (50%) |