
Image
|
Figure Caption
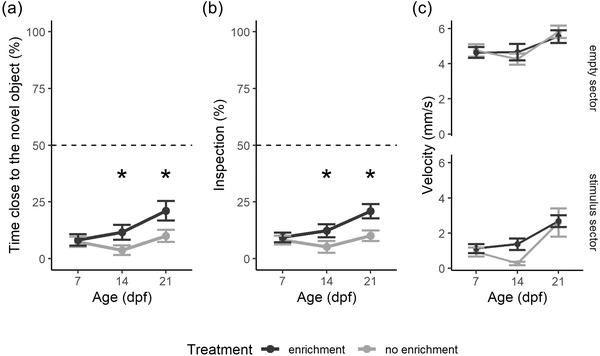
FIGURE 2
Neophobic response to novel object in 7‐, 14‐, and 21‐dpf larvae (experiment 1). (a) Percentage of time spent in the sector with the novel stimulus. (b) Percentage of inspections in the sector with the novel stimulus. (c) Swimming velocity in each sector. Subjects were divided for “enrichment” (dark gray) and “no enrichment” (light gray) treatment. Data points represented the mean ± standard error. Dotted lines represented the expected chance percentage (50%)
Acknowledgments
This image is the copyrighted work of the attributed author or publisher, and
ZFIN has permission only to display this image to its users.
Additional permissions should be obtained from the applicable author or publisher of the image.
Full text @ Dev Psychobiol