
- Title
-
Apelin signaling dependent endocardial protrusions promote cardiac trabeculation in zebrafish
- Authors
- Qi, J., Rittershaus, A., Priya, R., Mansingh, S., Stainier, D.Y.R., Helker, C.S.M.
- Source
- Full text @ Elife
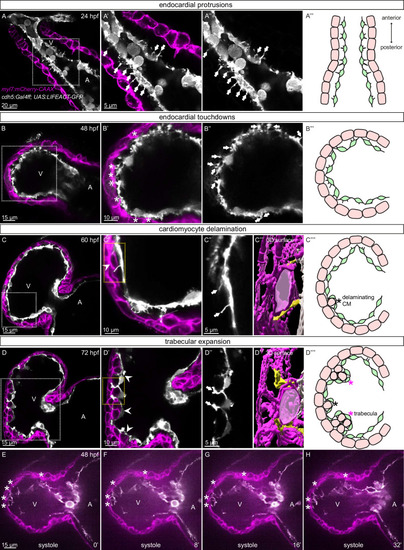
(A-D) Confocal projection images of the heart of Tg(myl7:mCherry-CAAX); Tg(cdh5:Gal4ff); Tg(UAS:LIFEACT-GFP) zebrafish at 24 (A), 48 (B), 60 (C) and 72 (D) hpf. (A-A’’) Endocardial protrusions (arrows) towards the myocardium at 24 hpf. (B-B’’) Endocardial protrusions (arrows) and touchdowns (asterisks) with the myocardium at 48 hpf. (C-C’’’) Endocardial protrusions (arrows) during CM delamination (arrowheads) at 60 hpf. (C’’’) 3D surface rendering of the area in the yellow box in C’. (D-D’’’) Endocardial protrusions (arrows) during trabecular assembly and expansion (arrowheads) at 72 hpf. (D’’’) 3D surface rendering of the area in the yellow box in D’. (A’’’’-D’’’’) Schematics of endocardial protrusions, endocardial touchdowns, CM delamination, and trabecular expansion. Black asterisks indicate delaminating CMs; purple asterisks indicate trabeculae. (E-H) Still images from a spinning disc time-lapse movie of a 48 hpf Tg(myl7:mCherry-CAAX); Tg(cdh5:Gal4ff); Tg(UAS:LIFEACT-GFP) heart; white asterisks indicate endocardial touchdowns; numbers in the bottom right corner refer to seconds. All images are ventral views, anterior to the top. V, ventricle; A, atrium.
|
( |
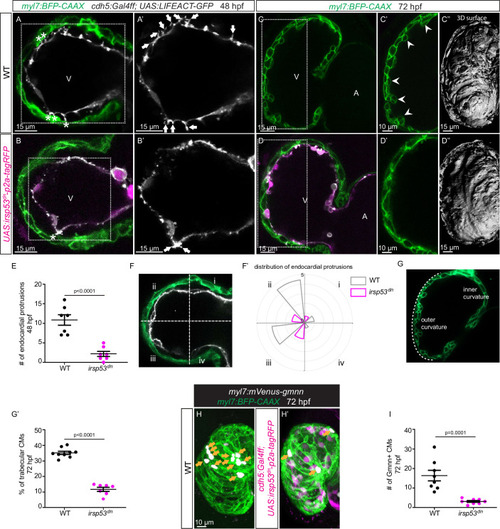
(A–D) Confocal projection images of the heart of Tg(myl7:BFP-CAAX); Tg(cdh5:Gal4ff); Tg(UAS:LIFEACT-GFP);±Tg(UAS:irsp53dn-p2a-tagRFP) zebrafish at 48 (A–B) and 72 (C–D) hours post-fertilization (hpf). (A–B) Endocardial protrusions (white arrows) and touchdowns (white asterisks) are reduced in embryos with endothelial overexpression of irsp53dn. (C–D) Cardiac trabeculation (arrowheads) is reduced in larvae with endothelial overexpression of irsp53dn; (C’–D) 3D rendering. (E) Quantification of the number of endocardial protrusions in wild-type and in embryos with endothelial overexpression of irsp53dn at 48 hpf. (F-F’) Illustration of the division of the 48 hpf ventricle into four regions (F). Distribution and average number of endocardial protrusions in different regions of mid-sagittal sections of the ventricle from 48 hpf wild-type and irsp53dn embryos (F’). (G–G’) Illustration of the division of the 72 hpf ventricle into the outer and inner curvature (G). Quantification of the percentage of trabecular cardiomyocytes (CMs) in the outer curvature of wild-type and irsp53dn larvae at 72 hpf (G’). (H–H’) 72 hpf larvae with endothelial overexpression of irsp53dn display a reduced number of myl7:mVenus-Gmnn+ CMs (yellow arrows) in their ventricle. (I) Quantification of the number of mVenus-Gmnn+ CMs in the ventricle of wild-type and irsp53dn larvae at 72 hpf. All images are ventral views, anterior to the top. V, ventricle; A, atrium. Data in graphs expressed as mean ± SEM.
|

(A–D) Confocal projection images of the heart of TgBAC(apln:EGFP); Tg(myl7:MKATE-CAAX) (A, B) and TgBAC(aplnrb:VenusPEST); Tg(kdrl:HsHRAS-mCherry) (C, D) zebrafish at 48 (A, C) and 72 (B, D) hours post-fertilization (hpf). (A’–’D’) Maximum intensity projections. (A–B) TgBAC(apln:EGFP) expression is detectable in the myocardium at 48 (A) and 72 (B) hpf. (C–D) TgBAC(aplnrb:VenusPEST) expression is detectable in the endocardium with higher expression in the ventricular endocardium at 48 (C) and 72 (D) hpf. All images are ventral views, anterior to the top. V, ventricle; A, atrium.
|

(A–F) Confocal projection images of the heart of Tg(cdh5:Gal4ff); Tg(UAS:LIFEACT-GFP) zebrafish at 24 hours post-fertilization (hpf) (A–B) and of the heart of Tg(myl7:mCherry-CAAX); Tg (cdh5:Gal4ff); Tg(UAS:LIFEACT-GFP) (C–F) zebrafish at 48 (C–D) and 72 (E–F) hpf. Maximum intensity projections (A–B) and mid-sagittal sections (C–F). (A) Endocardial protrusions (arrows) in apln+/+ embryos at 24 hpf. (B) The number of endocardial protrusions (arrows) is reduced in apln-/- siblings at 24 hpf. (C–D) The numbers of endocardial protrusions (arrows) and touchdowns (white asterisks) are reduced in apln-/- embryos (D) at 48 hpf compared with apln+/+ siblings (C). (E–F) apln-/- larvae (F) exhibit reduced trabeculation (arrowheads) and thicker cardiac jelly (CJ) (yellow asterisks) at 72 hpf compared with apln+/+ siblings (E). (G–H) Quantification of the number of endocardial protrusions in the ventricle of apln+/+ and apln-/- siblings at 24 (G) and 48 (H) hpf. (I) Distribution and average number of endocardial protrusions in different regions of mid-sagittal sections of the ventricle from 48 hpf apln+/+ and apln-/- siblings. (J) Quantification of the percentage of trabecular cardiomyocytes (CMs) in the outer curvature of apln+/+ and apln-/- siblings at 72 hpf. (K–K’) Maximum intensity projections. apln-/- larvae (K’) exhibit a thicker CJ at 72 hpf compared with apln+/+ siblings (K). (L) Quantification of the CJ volume in the outer curvature of apln+/+ and apln-/- siblings at 72 hpf. All images are ventral views, anterior to the top. V, ventricle; A, atrium; +/+, apln+/+; -/-, apln-/-. Data in graphs expressed as mean ± SEM.
|

( |

( |

( |
( |

(A–D) Confocal projection images of the heart of Tg(myl7:HsHRAS-EGFP) larvae at 72 hours post-fertilization (hpf). (A–B) Overexpression of nrg2a in the endothelium (B) leads to an increased number of trabeculae (arrowheads) and the multilayering of cardiomyocytes (CMs) (brackets) compared with wild-type (A). (C) Larvae with endothelial overexpression of nrg2a and irsp53dn exhibit a reduced number of trabeculae (arrowheads) and of multilayered CMs (brackets) compared with larvae with endothelial overexpression of nrg2a alone (B). (D) apln mutant larvae with endothelial overexpression of nrg2a exhibit a reduced number of trabeculae (arrowheads) and of multilayered CMs (brackets) compared with wild-type larvae with endothelial overexpression of nrg2a (B). (E) Quantification of the number of trabeculae. (F) Quantification of the number of trabecular CMs. (G) Quantification of the number of multilayered CMs in the ventricle. Brackets indicate multilayered CMs. All images are ventral views, anterior to the top. V, ventricle. Data in graphs expressed as mean ± SEM.
|

( |

(A–D) Maximum intensity projections of confocal images of the heart of Tg(myl7:ERK-KTR-Clover-p2a-H2B-tagBFP/mScarlet) larvae at 72 hours post-fertilization (hpf). (A) Visualization of Erk activity by a cardiomyocyte (CM)-specific ERK-kinase translocation reporter (KTR) reporter. Nuclear Clover expression (arrows) indicates CMs with inactive Erk signaling. (B) Larvae treated with an ErbB2 inhibitor exhibit an increased number of CMs with inactive Erk signaling (arrows) compared with control larvae (A). (C) Larvae with endothelial overexpression of irsp53dn exhibit an increased number of CMs with inactive Erk signaling (arrows) compared with control larvae (A). (D) apln mutant larvae exhibit an increased number of CMs with inactive Erk signaling (arrows) compared with apln+/+ siblings. (E) Quantification of the percentage of ventricular CMs with nuclear Clover expression. All images are ventral views, anterior to the top. V, ventricle. Data in graphs expressed as mean ± SEM.
|

( |

Schematic model. Schematic model depicts that inhibiting the formation of endocardial protrusions results in cardiac trabeculation defects via affecting neuregulin (Nrg)/ErbB signaling. |