
- Title
-
Identification and establishment of type IV interferon and the characterization of interferon-υ including its class II cytokine receptors IFN-υR1 and IL-10R2
- Authors
- Chen, S.N., Gan, Z., Hou, J., Yang, Y.C., Huang, L., Huang, B., Wang, S., Nie, P.
- Source
- Full text @ Nat. Commun.
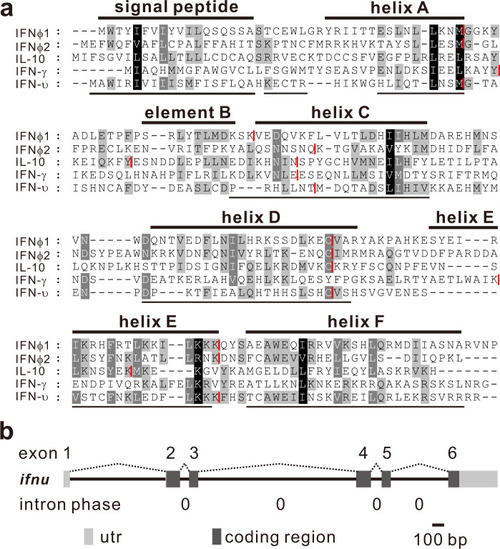
a Sequence alignment of IFN-υ protein. Identical or similar amino acids are indicated in shade. The putative signal peptide and helices of IFN-υ are underlined and the known helices A to F for zebrafish IFNφ1 are highlighted by solid lines above the alignment. Intron positions are indicated in red line. b The gene organization of zebrafish IFN-υ. Exons and introns are indicated with gray boxes and lines, respectively. The intron phases of ifnu are all zero. The utr indicates untranslated regions. |
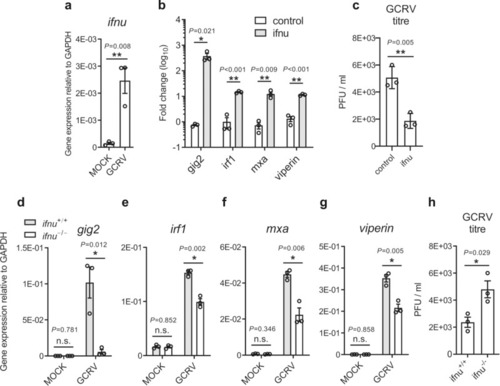
a Induction of IFN-υ gene by GCRV. Zebrafish larvae (5 dpf, n = 33) were infected with GCRV for 24 h and were collected to extract RNA to determine the expression of ifnu, which was normalized against gapdh, by using quantitative RT-PCR. b Induction of anti-viral ISGs in IFN-υ-stimulated zebrafish. Embryos (n = 150) were injected at one-cell stage with IFN-υ or empty vector plasmid, and after 72 h, the mRNA level of ISGs was detected by quantitative RT-PCR. The expression of the selected genes was normalized against gapdh and fold changes were calculated relative to control group (empty vector). c Analyses of viral titers in IFN-υ-stimulated zebrafish. Embryos (n = 150) at one-cell stage were expressed with IFN-υ plasmid or empty vector for 72 h, and the hatched zebrafish larvae (n = 33) were infected with GCRV for 24 h and then collected to detect viral titers. Effects of IFN-υ deficiency on ISG expression, such as gig2 (d), irf1 (e), mxa (f) and viperin (g), and viral titers (h) in response to GCRV infection. 5 dpf zebrafish (n = 33) were infected with GCRV for 24 h and then were collected to determine ISG expression and viral titer. The expression of the selected genes was normalized against gapdh. Data are expressed as mean ± SEM from three independent experiments. The two-tailed Student’s t test was used to determine the statistical significance, with * indicating P < 0.05, and ** indicating P < 0.01. |
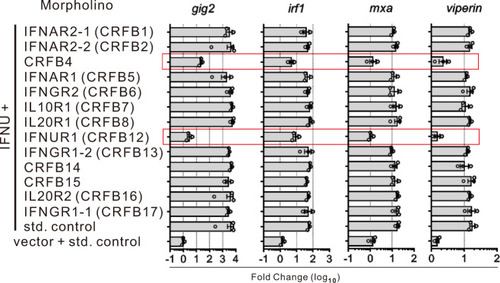
IFN-υ expressing plasmid and different morpholinos were co-injected into zebrafish embryos (n = 500) at one-cell stage and 48 h later the expression of ISGs was detected by quantitative RT-PCR. The expression of the selected genes was normalized against gapdh and fold changes were calculated relative to control group which was co-injected in embryos (n = 150) with empty plasmid (i.e., vector) and standard (std) control morpholinos. |
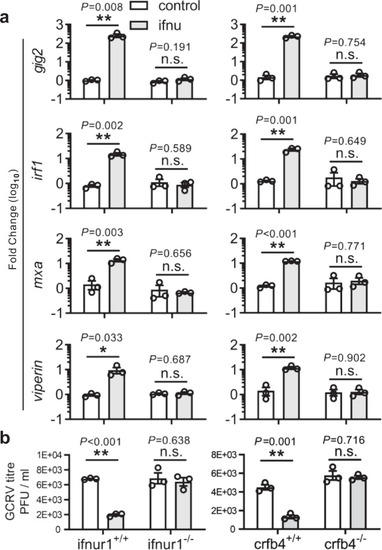
Analyses of ISG expression (a) and viral titer (b) in ifnur1 and crfb4 deficiency and WT zebrafish stimulated by IFN-υ. Embryos (n = 150) at one-cell stage were micro-injected with IFN-υ or control plasmids for 72 h, and hatched zebrafish larvae (n = 33) were collected for quantitative RT-PCR detection or infected with GCRV for 24 h to determine viral titer. The expression of ISGs was normalized against gapdh. Data are expressed as mean ± SEM from three independent experiments. The two-tailed Student’s t test was used to determine the statistical significance, with * indicating P < 0.05, and ** indicating P < 0.01, n.s. non-significancy. |
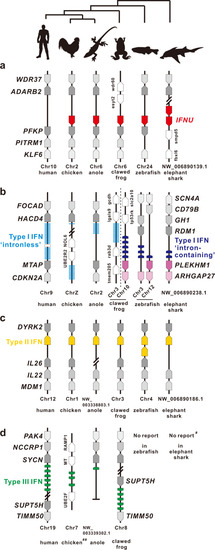
Gene synteny of IFNU (a), type I (b), II (c) and III IFN (d) loci in vertebrates. All genes are indicated with arrow symbols which point to the transcription direction. IFNU, type I, II and III IFNs are dyed using red, blue, yellow and green, respectively. The conserved and non-conserved neighbor genes are illustrated in gray and white, respectively. Evolutionary topology is supported by a recent study35. ♯ indicating no reports on type III IFN in elephant shark, but in catshark8, and ♯♯ chicken type III IFN locus which belongs to the conserved “IFNLB loci” in reptile and bird34. |

Protein sequences from class II cytokines in vertebrates were used to construct the neighbor-joining (NJ) tree. Sequence accession numbers are listed in Supplementary Table 5. |