
|
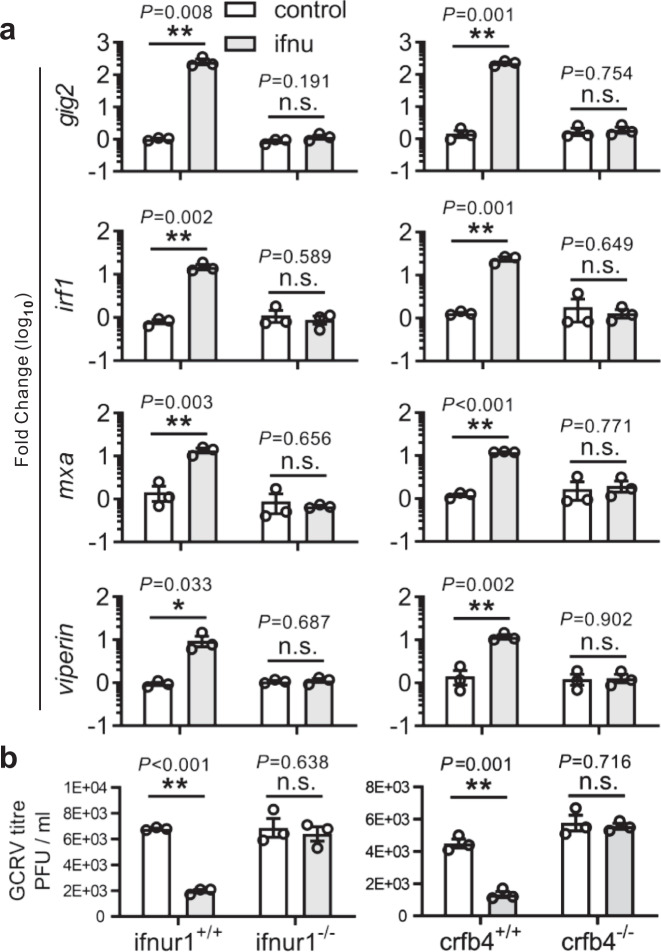
Fig. 4 Analyses of ISG expression (a) and viral titer (b) in ifnur1 and crfb4 deficiency and WT zebrafish stimulated by IFN-υ. Embryos (n = 150) at one-cell stage were micro-injected with IFN-υ or control plasmids for 72 h, and hatched zebrafish larvae (n = 33) were collected for quantitative RT-PCR detection or infected with GCRV for 24 h to determine viral titer. The expression of ISGs was normalized against gapdh. Data are expressed as mean ± SEM from three independent experiments. The two-tailed Student’s t test was used to determine the statistical significance, with * indicating P < 0.05, and ** indicating P < 0.01, n.s. non-significancy.