
- Title
-
Precise Dose of Folic Acid Supplementation Is Essential for Embryonic Heart Development in Zebrafish
- Authors
- Han, X., Wang, B., Jin, D., Liu, K., Wang, H., Chen, L., Zu, Y.
- Source
- Full text @ Biology (Basel)
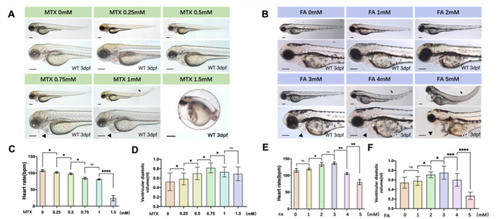
Zebrafish heart dysplasia caused by folic acid and folic acid inhibitors is dose-dependent. (A) The use of different concentrations of folic acid inhibitors can cause abnormal heart development in zebrafish embryos. The concentration of MTX1.5 mM will cause the zebrafish embryo to be deformed and unable to break the eggs. Arrowheads mark abnormal heart development. Arrows indicate trunk flexion. Scale bars: 500 μm. (B) Excessive folic acid can also cause abnormal heart development in zebrafish embryos. Scale bars: 500 μm. (C) The heart rate of zebrafish embryos treated with folic acid inhibitors was statistically analyzed. (D) The ventricular diastolic volume of zebrafish embryos treated with folic acid inhibitors was statistically analyzed. (E) The heart rate of zebrafish embryos treated with different concentrations of folic acid was analyzed statistically. (F) The ventricular diastolic volume of zebrafish embryos treated with different concentrations of folic acid was statistically analyzed. (Student t-test, * p < 0.05, ** p < 0.01, *** p < 0.001, **** p < 0.0001, ns: no statistical difference). |
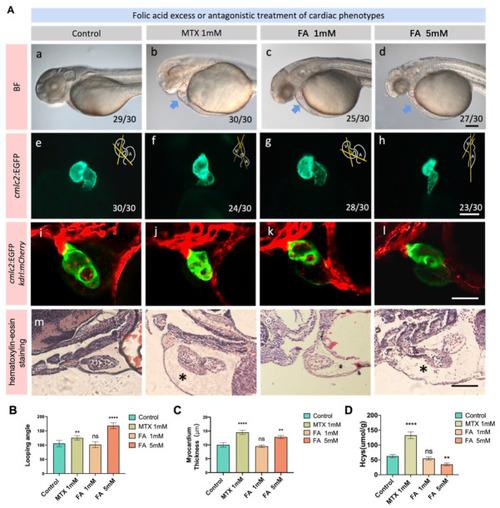
Folate excess and deficiency lead to different degrees of abnormal cardiac physiological function and abnormal metabolism of homocysteine. (A) The phenotypes of zebrafish embryonic heart treated with different concentrations of folic acid and MTX inhibited folate metabolism pathway were demonstrated at 3 dpf. (a–d) is the view under light microscope, (e–h) is cmlc2:EGFP labeled cardiac fluorescence images, (i–l) is cmlc2:EGFP and kdrl:mCherry Co labeled confocal images of the heart. (m–p) is images of a paraffin section of a zebrafish heart after staining by hematoxylin-eosin. Scale bars: 100 μm. (B) Statistics on the influence of different folic acid treatment groups on the looping angle of zebrafish embryo heart. (C) Statistics on the influence of different folic acid treatment groups on the thickness of the ventricular myocardium of zebrafish embryos. (D) High homocysteine content in zebrafish of different groups. (Student t-test, * p < 0.05, ** p < 0.01, **** p < 0.0001, ns: no statistical difference). |
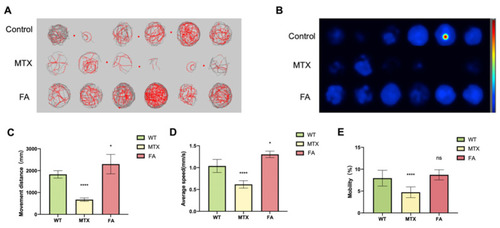
Zebrafish Behavioral Experimental Data Statistics. (A) Digital tracks of larvae from wildtype (WT), MTX 1 mM and FA 1 mM groups at 5 dpf. (B) Heat maps of the digital tracks A. (C) The ten-minute activity distance statistics of zebrafish embryos in different groups. (D) Statistics on the average activity speed of zebrafish embryos in different groups. (E) Mobility statistics of zebrafish embryos in different groups. (Student t-test, * p < 0.05, **** p < 0.0001, ns: no statistical difference.). |
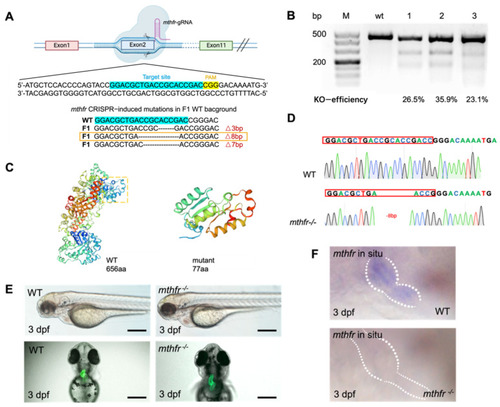
Generation of mthfr mutant using the CRISPR/Cas9 system. (A) Design of sgRNA target on exon 2 of zebrafish mthfr gene. The mutation type of code shift selected by orange frame is selected finally. (B) Two short DNA fragments were obtained by T7E1 digestion. In the control group, 437 bp fragment was amplified from wild-type embryos with the same set of primers. (C) The predicted truncation of Mthfr protein. (D) Sequencing map of homozygous zebrafish adults. (E) Bright-field views of mthfr−/− zebrafish showed Pericardial enlargement, ventricular enlargement and abnormal heart looping. Scale bars: 500 μm. (F) The results of in situ hybridization showed that the expression of mthfr gene in homozygous mutant zebrafish was changed. |
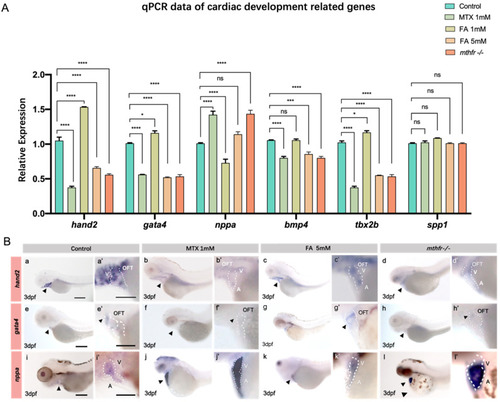
Abnormal folate metabolism results in changes of zebrafish embryo heart development gene expression. (A) Results of qPCR for hand2, nkx2.5, gata4, bmp4, tbx2b, spp1, hoxb1a, nppa in the embryonic heart of zebrafish in each group. (Student t-test, * p < 0.05, *** p < 0.001, **** p < 0.0001, ns: no statistical difference.) (B) In situ hybridization showed the expression of hand2, gata4, nppa in different groups of 3 dpf zebrafish embryonic hearts. (a–d‘) is the in situ expression of the hand2 gene at different exposure concentrations, (e–h‘) is the in situ expression of the gata4 gene at different exposure concentrations, (i–l‘) is the in situ expression of the nppa gene at different exposure concentrations. A: atrium V: ventricle OFT: outflow tract. n = 3. Scale bars: 200 μm. |
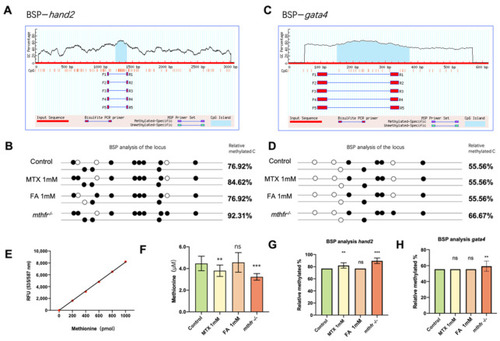
Effects of folic acid on partial gene methylation in zebrafish embryos. (A) The CpG island of hand2 gene for the BSP experiment was predicted and selected. (B) Zebrafish embryos with different folate metabolism groups BSP analysis of the locus of hand2. (C) The CpG island of gata4 gene for the BSP experiment was predicted and selected. (D) Zebrafish embryos with different folate metabolism groups BSP analysis of the locus of gata4. (E) Standard curve fitting based on the standard sample. (F) Methionine levels in heart cells of different folate treatment groups and mthfr homozygous mutants. (G) Relative methylated BSP analysis of the hand2 promoter locus. (H) Relative methylated BSP analysis of the gata4 promoter locus. (Student t-test, ** p < 0.01, *** p < 0.001, ns: no statistical difference). |
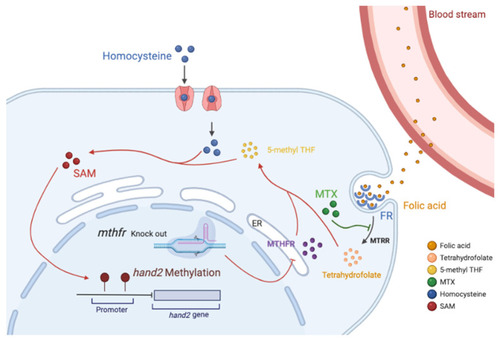
Model of folate dose-dependent regulation on zebrafish heart development. ER: Endoplasmic reticulum; FR: Folate receptor; SAM: S-adenosylmethionine; Folic acid enters the cell through the folate receptor and undergoes the metabolic cycle. MTX specifically antagonizes MTRR, and knockout of the mthfr gene inhibits the endoplasmic reticulum synthesis MTHFR enzyme. These factors cause the conversion of folic acid to 5-methyl THF to be blocked, which reduces the efficiency of the conversion of homocysteine to methionine in the cell. Decreasing the content of methionine leads to a decrease in the content of DNA methylation donor SAM, which in turn affects the methylation of the hand2 promoter. This can lead to abnormal embryonic heart development. |