
IMAGE
Figure 3
- ID
- ZDB-IMAGE-220131-214
- Publication
- Han et al., 2021 - Precise Dose of Folic Acid Supplementation Is Essential for Embryonic Heart Development in Zebrafish
- All Figures
- Figures for Han et al., 2021
Image
|
Figure Caption
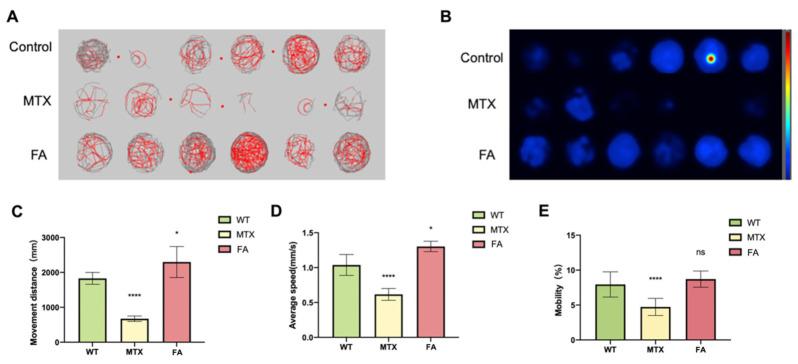
Figure 3
Zebrafish Behavioral Experimental Data Statistics. (A) Digital tracks of larvae from wildtype (WT), MTX 1 mM and FA 1 mM groups at 5 dpf. (B) Heat maps of the digital tracks A. (C) The ten-minute activity distance statistics of zebrafish embryos in different groups. (D) Statistics on the average activity speed of zebrafish embryos in different groups. (E) Mobility statistics of zebrafish embryos in different groups. (Student t-test, * p < 0.05, **** p < 0.0001, ns: no statistical difference.).
Acknowledgments
This image is the copyrighted work of the attributed author or publisher, and
ZFIN has permission only to display this image to its users.
Additional permissions should be obtained from the applicable author or publisher of the image.
Full text @ Biology (Basel)