
- Title
-
Ablation of mpeg+ Macrophages Exacerbates mfrp-Related Hyperopia
- Authors
- Brandt, Z.J., Collery, R.F., Besharse, J.C., Link, B.A.
- Source
- Full text @ Invest. Ophthalmol. Vis. Sci.
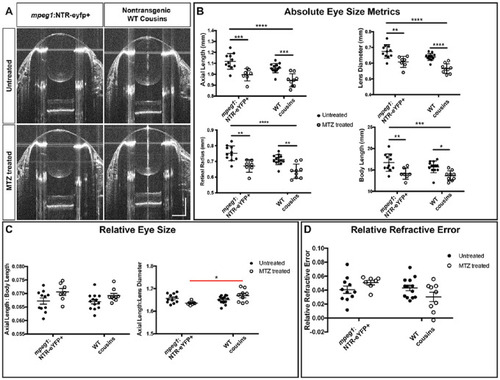
Ablation of macrophages in WT zebrafish did not significantly impact emmetropization. (A) Representative SD-OCT B-scans from the center of mpeg1:NTR-eYFP+ eyes and their WT cousins with or without MTZ treatment. (B) Axial length, lens diameter, retinal radius, and body length of mpeg1:NTR-eYFP+ fish and their WT cousins with or without MTZ treatment. (C) Axial length normalized to body length and lens diameter. (D) Relative refractive error. Two-way ANOVA was used for statistical analysis for (B) to (D). P values are shown from Tukey's multiple comparisons for post hoc analysis. Red bars indicate statistical significance likely due to mpeg1+ cell ablation. *P < 0.05, **P < 0.01, ***P < 0.001, ****P < 0.0001. For mpeg1:NTR-eYFP+ untreated, n = 11; for mpeg1:NTR-eYFP+ MTZ treated, n = 7; for WT cousins untreated, n = 13; for WT cousins MTZ treated, n = 9. PHENOTYPE:
|

Efficient macrophage ablation in the mfrp retina. (A–D) mpeg1:NTR-eYFP expression in WT and mfrp–/– retina flat-mount preparations with and without MTZ treatment. (A'-D') Immune staining for 4C4 antibody marking macrophages. (A''–D'') Merged and colorized images of A–D', with blue representing 4C4 and yellow representing YFP. (A'''–D''') Higher magnification images of (A'') to (D''). (E, F) Cell counts of mpeg1:NTR-eYFP+ cells (E) or 4C4+ cells (F) in WT and mfrp–/– retina flat-mount preparations with and without MTZ treatment. Two-way ANOVA was used for statistical analysis. Sidak's multiple comparisons were used for post hoc analysis. *P < 0.05, **P < 0.01, ***P < 0.001, ****P < 0.0001. For WT untreated, n = 5; for WT MTZ treated, n = 2; for mfrp–/– untreated, n = 5; for mfrp–/– MTZ treated, n = 6. EXPRESSION / LABELING:
PHENOTYPE:
|
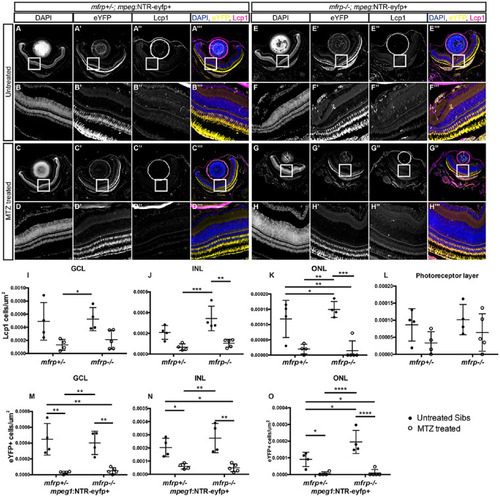
Distribution of macrophage accumulation and ablation across mfrp+/–; and mfrp–/– retinae. (A–H) Representative images of central retina sections from mfrp+/–; mpeg1:NTR-eYFP+ and mfrp–/–; mpeg1:NTR-eYFP+ MTZ treated and untreated fish. (A–H) Grayscale DAPI images at low magnification (A, C, E, G) and high magnification (B, D, F, H). (A'–H') Grayscale eYFP images at low magnification (A', C', E', G') and high magnification (B', D', F', H'). (A''–H'') Grayscale Lcp1 images at low magnification (A'', C'', E'', G'') and high magnification (B'', D'', F'', H''). Colorized merged images with DAPI are shown in blue, eYFP in yellow, and Lcp1 in magenta; images are at low magnification (A''', C''', E''', G''') and high magnification (B''', D''', F''', H'''). (I–L) Quantification of the number of Lcp1+ cells per µm2 in the ganglion cell layer (I) and inner (J) and outer (K) nuclear layer, and photoreceptor layer (L). (M–O) Quantification of the number of eYFP+ cells per µm2 in the ganglion cell layer (M) and inner (N) and outer (O) nuclear layer. Error bars represent standard deviations. Two-way ANOVA was used for statistical analysis for (I) to (O). P values are shown from Tukey's multiple comparisons for post hoc analysis. *P < 0.05, **P < 0.01, ***P < 0.001, ****P < 0.0001. For mfrp+/– untreated, n = 4; for mfrp+/– MTZ treated, n = 4; for mfrp–/– untreated, n = 4; for mfr–/– MTZ treated, n = 5. EXPRESSION / LABELING:
PHENOTYPE:
|
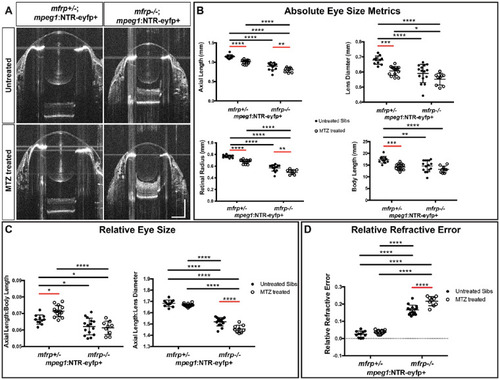
Macrophage ablation exacerbated hyperopia in mfrp–/– zebrafish. (A) Representative SD-OCT B-scans from the center of mfrp+/–; mpeg1:NTR-eYFP+ eyes and their mfrp–/–; mpeg1:NTR-eYFP+ siblings with or without MTZ treatment. (B) Eye size metrics of mfrp+/–; mpeg1:NTR-eYFP+ and mfrp–/–; mpeg1:NTR-eYFP+ fish with or without MTZ treatment. (C) Axial length normalized to body length and lens diameter. (D) Relative refractive error. Two-way ANOVA was used for statistical analysis. P values are shown from Tukey's multiple comparisons for post hoc analysis. Error bars represent standard deviation. Red bars indicate statistical significance due to MTZ treatment. *P < 0.05, **P < 0.01, ***P < 0.001, ****P < 0.0001. For mfrp+/– untreated, n = 11; for mfrp+/– MTZ treated, n = 14; for mfrp–/– untreated, n = 15; for mfrp–/– MTZ treated, n = 9. PHENOTYPE:
|
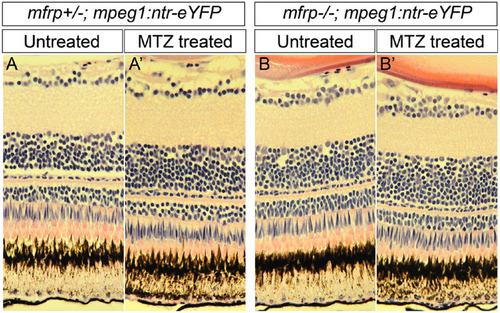
Macrophage ablation did not significantly alter retina morphology. (A–B') Hematoxylin and eosin–stained paraffin histology of the central retina in mfrp+/–; mpeg1:NTR-eYFP+ (A, A') and mfrp–/–; mpeg1:NTR-eYFP+ (B, B') with and without MTZ treatment. PHENOTYPE:
|
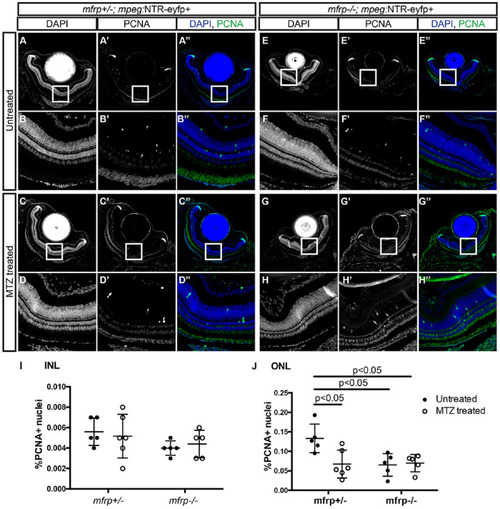
Proliferative effects of mfrp deletion and macrophage ablation. (A–H) Representative images of central retina sections from mfrp+/–; mpeg1:NTR-eYFP+ and mfrp–/–; mpeg1:NTR-eYFP+ MTZ treated and untreated fish. (A–H) Grayscale DAPI images at low magnification (A, C, E, G) and high magnification (B, D, F, H). (A'–H') Grayscale PCNA images at low magnification (A', C', E', G') and high magnification (B', D', F', H'). (A''–H'') Colorized merged images with DAPI in blue and PCNA in green; images are at low magnification (A'', C'', E'', G'') and high magnification (B'', D'', F'', H''). (I–J) Quantification of the percentage of PCNA+ nuclei in the inner (I) and outer (J) nuclear layer. Error bars represent standard deviations. Two-way ANOVA was used for statistical analysis for (I) and (J). P values are shown from Tukey's multiple comparisons for post hoc analysis. For mfrp+/– untreated, n = 5; for mfrp+/– MTZ treated, n = 6; for mfrp–/– untreated, n = 5; for mfrp–/– MTZ treated, n = 5. PHENOTYPE:
|
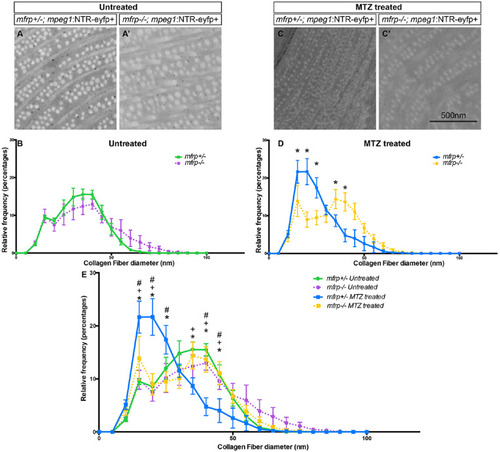
Collagen fibril diameter in mfrp+/– and mfrp–/– sclera with and without macrophage ablation. Representative examples of collagen fibrils in the central posterior sclera of mfrp+/–; mpeg1:NTR-eYFP+ (A) and mfrp–/–; mpeg1:NTR-eYFP+ (A') untreated fish. (B) Frequency distribution of collagen fiber diameter with y-axis = relative frequency as a percentage and x-axis = collagen fiber diameter in 5-nm bins. mfrp+/– is indicated by a green line, mfrp–/– by a purple line. For mfrp+/–, n = 3; for mfrp–/–, n = 4. (C) Representative examples of collagen fibrils in the central posterior sclera of mfrp+/–; mpeg1:NTR-eYFP+ (C) and mfrp–/–; mpeg1:NTR-eYFP+ (C') MTZ treated fish. (D) Frequency distribution of collagen fiber diameter with y-axis = relative frequency as a percentage and x-axis = collagen fiber diameter in 5-nm bins. mfrp+/– is represented by a blue line, mfrp–/– by a yellow line. For mfrp+/–, n = 5; for mfrp–/–, n = 5. Multiple t-tests were used for statistical analysis. *P < 0.001. (E) Combined graph of (B) and (D). Errors bars represent standard deviations throughout figure. Two-way ANOVA with Tukey's multiple-comparisons were used for statistical analysis. An asterisk (*) denotes a significant difference between mfrp+/– MTZ treated and mfrp–/– MTZ treated; a plus sign (+) denotes a significant difference between mfrp+/– MTZ treated and mfrp+/– untreated; and the pound symbol (#) denotes a significant difference between mfrp+/– MTZ treated and mfrp–/– untreated. P < 0.05 for all significant differences in (E). PHENOTYPE:
|

Macrophage ablation alters scleral accessibility to a collagen hybridizing peptide. (A–C) Representative images of central retina sections from mfrp+/–; mpeg1:NTR-eYFP+ and mfrp–/–; mpeg1:NTR-eYFP+ MTZ treated and untreated fish. (A–A''') Grayscale CHP images. (B–B''') Colorized and merged images with DAPI in cyan and CHP in red. (C–C''') High-magnification images of regions of interest in the posterior sclera as indicated by white outlines in (B) to (B'''). (D, E) Quantification of the mean pixel intensity of the CHP staining across full sclera (D) and at central posterior sclera (E). For whole sclera (D), both genotype (P = 0.001) and MTZ treatment (P = 0.022) had a significant effects. In the posterior sclera (E) only genotype (P = 0.0204) had a significant effect. Two-way ANOVA was used for statistical analysis. P values are shown from Sidak's multiple comparisons for post hoc analysis. Error bars represent standard deviations. *P < 0.05. For mfrp+/– untreated, n = 6; for mfrp+/– MTZ treated, n = 6; for mfrp–/– untreated, n = 6; for mfrp–/– MTZ treated, n = 5. PHENOTYPE:
|