
- Title
-
Common Genetic Variants Contribute to Risk of Transposition of the Great Arteries
- Authors
- Skoric-Milosavljevic, D., Tadros, R., Bosada, F.M., Tessadori, F., van Weerd, J.H., Woudstra, O.I., Tjong, F.V.Y., Lahrouchi, N., Bajolle, F., Cordell, H.J., Agopian, A.J., Blue, G.M., Barge-Schaapveld, D.Q., Gewillig, M.H., Preuss, C., Lodder, E.M., Barnett, P., Ilgun, A., Beekman, L., van Duijvenboden, K., Bokenkamp, R., Müller-Nurasyid, M., Vliegen, H.W., Konings, T.C., van Melle, J.P., van Dijk, A., van Kimmenade, R.R., Roos-Hesselink, J.W., Sieswerda, G., Meijboom, F., Abdul-Khaliq, H., Berger, F., Dittrich, S., Hitz, M.P., Moosmann, J., Riede, F.T., Schubert, S., Galan, P., Lathrop, G.M., Munter, H.M., Al-Chalabi, A., Shaw, C.E., Shaw, P.J., Morrison, K.E., Veldink, J.H., van den Berg, L.H., Evans, S.M., Nobrega, M.A., Aneas, I., Radivojkov-Blagojevic, M., Meitinger, T., Oechslin, E., Mondal, T., Bergin, M.L., Smythe, J.F., Altamirano-Diaz, L., Lougheed, J., Bouma, B.J., Chaix, M.A., Kline, J., Bassett, A.S., Andelfinger, G., van der Palen, R.L., Bouvagnet, P., Clur, S.B., Breckpot, J., Kerstjens-Frederikse, W.S., Winlaw, D.S., Bauer, U., Mital, S., Goldmuntz, E., Keavney, B.D., Bonnet, D., Mulder, B.J., Tanck, M., Bakkers, J., Christoffels, V.M., Boogerd, C.J., Postma, A.V., Bezzina, C.R.
- Source
- Full text @ Circ. Res.
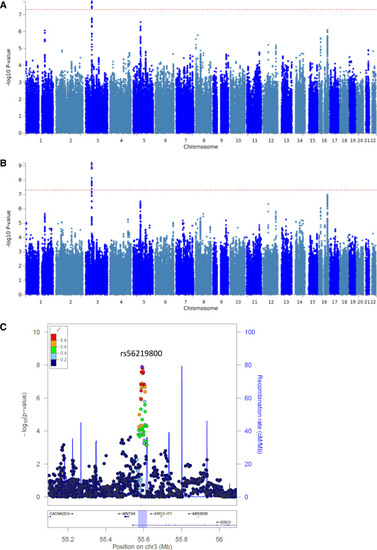
Manhattan plots of the genome-wide association results. P of all tested single nucleotide polymorphisms (SNPs) on a –log10 scale from the logistic regression analysis in the discovery set including 1094 cases and 3282 controls (A) and the meta-analysis of the discovery and replication set including 1237 cases and 3711 controls (B). Dashed lines represent genome-wide significance P thresholds of 5×10⁻⁸. C, Regional association plot of the 3p14.3 locus and surrounding genes (±500 kb). The y-axis represent the −log10(P) values from the meta-analysis. Round points represent SNPs in this region, colored by degree of linkage disequilibrium with rs56219800, the top associated SNP (purple point). The blue highlighted region represents the size of the locus, as defined by all SNPs with an r2≥0.5 with the lead SNP and that showed an association P of <10−3. |
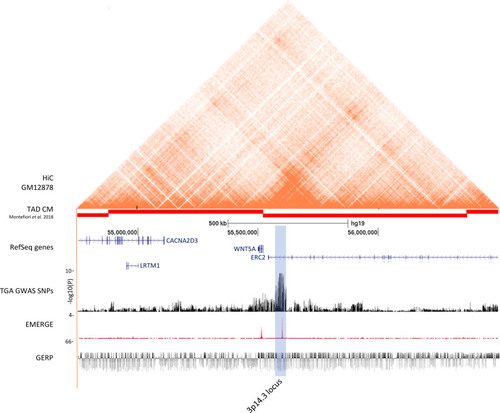
Functional annotation of the 3p14.3 locus. From top to bottom: Hi-C data from the human lymphobastoid line GM1287879; TADs derived from iPSC-CMs80; RefSeq genes; results from the TGA genome-wide association studies meta-analysis on a –log10(P) scale; human EMERGE track42; Genomic Evolutionary Rate Profiling (GERP) conservation track.81 The blue highlighted region represents the genome-wide associated 3p14.3 locus near WNT5A. |
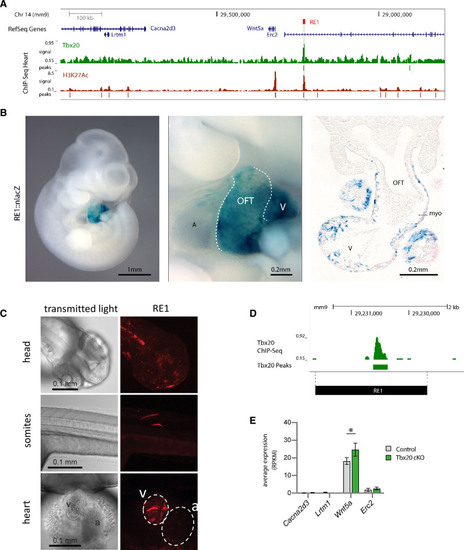
Characterization of RE1 in mouse and zebrafish. A, Genome browser view from the mouse orthologous Wnt5a genomic region. ChIP-seq tracks of TBX20 and H3K27Ac are displayed below. B, Representative embryos showing that RE1-lacZ reporter expression is observed in the developing murine heart, including outflow tract myocardium and ventricles. In total, 5 embryos were analyzed. A, atrium; V, ventricle; OFT, outflow tract. C, Representative image of 2dpf zebrafish showing RE1 activity in various organs and tissues, including the heart. In total, 296 embryos were analyzed. White dashed lines represent boundaries of ventricle and atrium. v: ventricle; a: atrium. D, TBX20 ChIP-Seq demonstrating RE1 to be bound by TBX20. E, Expression levels (average normalized read counts and SD) of Wnt5a and flanking genes in E11.5 FACS sorted cardiomyocytes from control (n=4) and cTnT-Cre;Tbx20 mutant murine hearts (n=4), *P=0.04, using limma38 adjusted for multiple testing using Benjamini-Hochberg correction. |
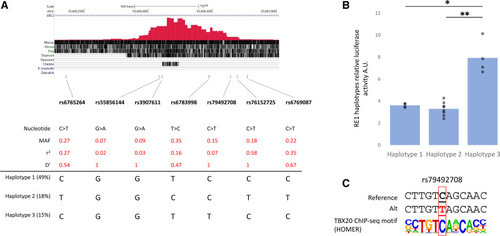
Regulatory activity of RE1 for the 3 major human haplotypes in vitro. A, Genome browser view from the human RE1 region (ie, chr3:55,605,229-55,607,027; GRCh37), depicting the location and characteristics of the single nucleotide polymorphisms (SNPs) within RE1 and the 3 major haplotypes. Provided r2 and D-prime are in relationship to the lead SNP rs56219800. B, Luciferase activity were measured in HL1 cells transfected with constructs for RE1 haplotype 1 (n=4), haplotype 2 (n=8), and haplotype 3 (n=4). Values were normalized to the activity of empty pGL4-SCP1-luc. *P=2.6×10⁻⁵, **P=2.6×10⁻⁶ (1-way ANOVA). C, TBX20 motif sequence as identified by HOMER motif analysis showing rs79492708 abolishes a TBX20-binding site. |