
|
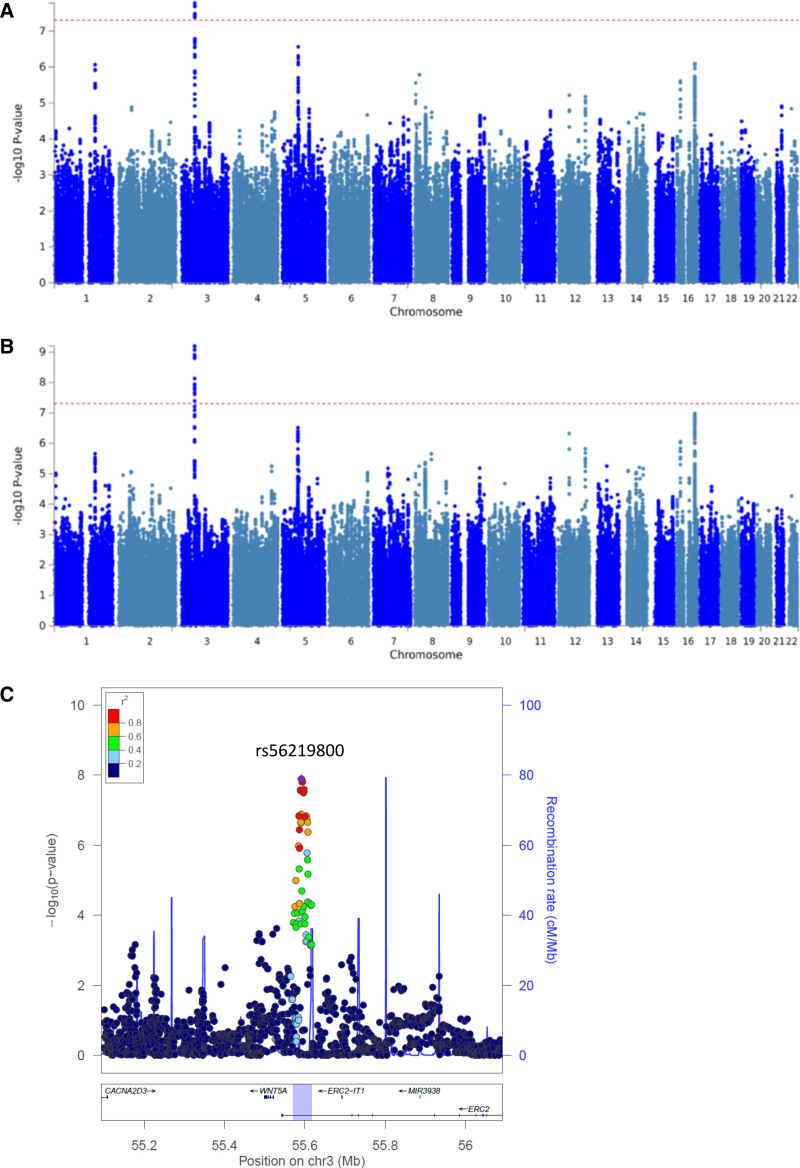
Fig. 1
Manhattan plots of the genome-wide association results. P of all tested single nucleotide polymorphisms (SNPs) on a –log10 scale from the logistic regression analysis in the discovery set including 1094 cases and 3282 controls (A) and the meta-analysis of the discovery and replication set including 1237 cases and 3711 controls (B). Dashed lines represent genome-wide significance P thresholds of 5×10⁻⁸. C, Regional association plot of the 3p14.3 locus and surrounding genes (±500 kb). The y-axis represent the −log10(P) values from the meta-analysis. Round points represent SNPs in this region, colored by degree of linkage disequilibrium with rs56219800, the top associated SNP (purple point). The blue highlighted region represents the size of the locus, as defined by all SNPs with an r2≥0.5 with the lead SNP and that showed an association P of <10−3.