
- Title
-
Wnt/β-catenin signaling acts cell-autonomously to promote cardiomyocyte regeneration in the zebrafish heart
- Authors
- Bertozzi, A., Wu, C.C., Hans, S., Brand, M., Weidinger, G.
- Source
- Full text @ Dev. Biol.
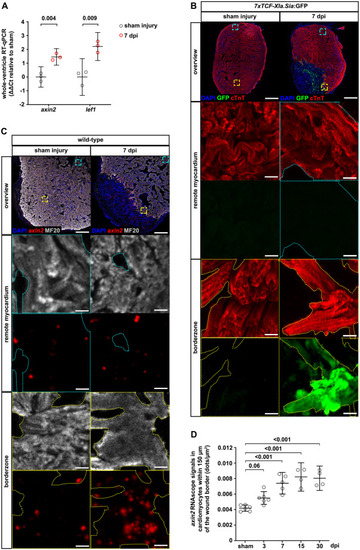
Fig. 1. Wnt/β-catenin signaling is active in cardiomyocytes at the wound border in the cryoinjured zebrafish heart. (A) axin2 and lef1 expression levels in the whole ventricle of sham-injured and cryoinjured heart at 7 days post cryoinjury (dpi), measured by RT-qPCR. Values are plotted as ΔΔCt relative to sham-injury. Error bars represent s.e.m. n (biological replicates) = 3 (sham injury), 3 (7 dpi). 3 hearts were pooled for each sample. Numbers indicate p-value determined by unpaired Welch's unequal variances t-test. (B) GFP immunofluorescence in cardiac troponin T (cTnT)+ cardiomyocytes from the wound borderzone or the remote area of the myocardium in sham-injured and 7 dpi hearts of 7xTCF-Xla.Sia:GFPia4Tg fish. n (hearts) = 7 (sham injury), 7 (7 dpi). In the overview, the cyan and yellow dashed squares represent the magnified portion of the myocardium from the remote area and the borderzone, respectively. In the magnified view, the cyan and yellow dotted lines represent the outline of the cTnT+ cardiomyocyte area. Scale bars, 100 μm (overview), 10 μm (magnification). (C) axin2 RNAscope signals in MF20+ cardiomyocytes from the borderzone or the remote area of the myocardium of sham-injured and 7 dpi hearts. Scale bars, 100 μm (overview), 10 μm (magnification). (D) Quantification of axin2 RNAscope signals in borderzone cardiomyocytes of hearts after sham injury and at 3, 7, 15 and 30 dpi. Error bars represent CI 95%. n (hearts) = 6 (sham-injury), 6 (3 dpi), 5 (7 dpi), 4 (15 dpi), 4 (30 dpi). One-way ANOVA with Dunnett's multiple comparisons test. |

Fig. 2. Validation of IWR1 and of the hsp70l:Mmu.Axin1-YFP (hs:Axin1-YFP) transgenic line as tools to inhibit Wnt/β-catenin signaling in the adult zebrafish heart. (A) YFP immunofluorescence in cryoinjured hearts of hs:Axin1-YFP fish and wild-type siblings, harvested 6 h after a single heat shock (h.s.) at 7 dpi. n (hearts) = 6 (wild-type), 6 (hs:Axin1-YFP). In the overview, the magenta dashed squares represent the magnified portion of the myocardium. The yellow dotted lines represent the outline of the magnified MF20+ cardiomyocyte area, the cyan dotted lines represent the outline of the magnified MF20— area occupied by what we consider endothelial cells in the wound. Scale bars, 100 μm (overview), 10 μm (magnification). (B) axin2 RNAscope signals in MF20+ borderzone cardiomyocytes of hs:Axin1-YFP fish and wild-type siblings, harvested 6 h after single heat shock (h.s.) at 7 dpi. n (hearts) = 16 (wild-type), 16 (hs:Axin1-YFP). The yellow dotted lines represent the outline of the MF20+ cardiomyocyte area. Scale bars, 100 μm (overview), 10 μm (magnification). Error bars represent CI 95%. Unpaired Welch's unequal variances t-test. (C) Quantification of axin2 RNAscope signals in borderzone cardiomyocytes of cryoinjured hearts from fish treated with DMSO or IWR1 from 1 to 7 dpi. Error bars represent CI 95%. n = 8 (DMSO), 7 (IWR1). Unpaired Welch's unequal variances t-test. |

Fig. 3. Inhibition of Wnt/β-catenin signaling impedes maturation and resorption of the scar. (A) Acid Fuchsin Orange G (AFOG) staining of cryoinjured hearts of hs:Axin1-YFP fish and wild-type siblings, heat-shocked (h.s.) daily starting from 1 dpi and harvested at 3 or 60 dpi. Blue = collagen, purple = fibrin, brown = healthy myocardium. The yellow dashed squares represent the magnified area showing details of the wound. Green dashed lines outline the wound/scar area. Scale bars, 100 μm (overview), 10 μm (magnification). (B) Quantification of scar size of cryoinjured hearts of hs:Axin1-YFP fish and wild-type siblings, heat-shocked (h.s.) daily starting from 1 dpi and harvested at either 3 dpi or 60 dpi. n (hearts) = 8 (3 dpi, wild-type), 9 (3 dpi, hs:Axin1-YFP), 9 (60 dpi, wild-type), 10 (60 dpi, hs:Axin1-YFP). Error bars represent CI 95%. Unpaired Welch's unequal variances t-test. (C) Quantification of the area occupied by fibrin relative to the entire scar area of cryoinjured hearts which contained a residual scar from hs:Axin1-YFP fish and wild-type siblings, heat-shocked (h.s.) daily starting from 1 dpi and harvested at 60 dpi. n (hearts) = 6 (60 dpi, wild-type), 10 (60 dpi, hs:Axin1-YFP). Error bars represent CI 95%. Unpaired Welch's unequal variances t-test. |
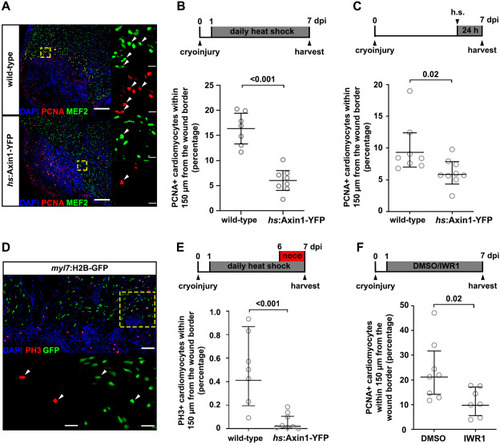
Fig. 4. Inhibition of Wnt/β-catenin signaling impairs cardiomyocyte proliferation. (A) PCNA and MEF2 immunostaining on cryoinjured hearts of hs:Axin1-YFP fish and wild-type siblings, heat-shocked daily from 1 to 7 dpi. n (hearts) = 7 (wild-type), 8 (hs:Axin1-YFP). White arrowheads point to PCNA+MEF2+ cardiomyocytes. Scale bars, 100 μm (overview), 10 μm (magnification). (B) Quantification of the data shown in (A). Error bars represent CI 95%. Unpaired Welch's unequal variances t-test. (C) Quantification of PCNA+MEF2+/MEF2+ borderzone cardiomyocytes of cryoinjured hearts of hs:Axin1-YFP fish and wild-type siblings, heat-shocked (h.s.) at 6 dpi and harvested after 24 h at 7 dpi. n (hearts) = 8 (wild-type), 9 (hs:Axin1-YFP). Error bars represent CI 95%. Unpaired Welch's unequal variances t-test. (D) PH3 and GFP immunostaining on 7 dpi myl7:H2B-GFP hearts. White arrowheads point to PH3+GFP+ cardiomyocytes. Scale bars, 100 μm (overview), 10 μm (magnification). (E) Quantification of PH3+GFP+/GFP+ borderzone cardiomyocytes of cryoinjured hearts of hs:Axin1-YFP, myl7:H2B-GFP fish and myl7:H2B-GFP siblings (wild-type for hs:Axin1-YFP), heat-shocked daily from 1 to 7 dpi and treated with nocodazole (abbreviated noco) in the last 24 h before harvesting at 7 dpi. n (hearts) = 7 (wild-type), 8 (hs:Axin1-YFP). Error bars represent CI 95%. Unpaired Welch's unequal variances t-test. (F) Quantification of PCNA+MEF2+/MEF2+ borderzone cardiomyocytes of cryoinjured hearts from fish treated with DMSO or IWR1 from 1 to 7 dpi. Error bars represent CI 95%. n = 8 (DMSO), 7 (IWR1). Unpaired Welch's unequal variances t-test. |
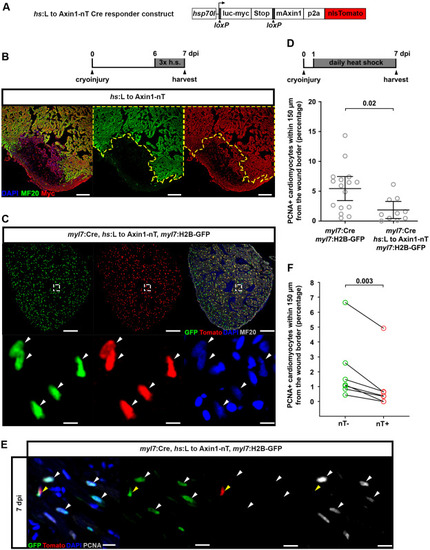
Fig. 5. Wnt/β-catenin signaling acts cell-autonomously in cardiomyocytes to promote cell cycle re-entry. (A) Illustration of the Cre responder construct hsp70l:LOXP-luc-myc-STOP-LOXP-mAxin1-p2a-nlsTomato, cryaa:AmCyan (abbreviated hs:L to Axin1-nT). (B) MF20 and Myc immunostaining to detect expression of myc-tagged luciferase in cryoinjured hs:L to Axin1-nT hearts, heat-shocked (h.s.) 3 times every 8 h from 6 dpi and harvested at 7 dpi 8 h after the last heat-shock. The yellow dotted lines represent the outline of the MF20+ cardiomyocyte area. n (hearts) = 5. Scale bars, 100 μm. (C) Tomato, GFP and MF20 immunostaining of hearts from heat-shocked myl7:Cre, hs:L to Axin1-nT, myl7:H2B-GFP fish. White arrowheads point to DAPI+nT+GFP+ cardiomyocyte nuclei. Scale bars, 100 μm (overview), 10 μm (magnification). (D) Quantification of PCNA+GFP+/GFP+ borderzone cardiomyocytes of cryoinjured hearts from myl7:Cre, hs:L to Axin1-nT, myl7:H2B-GFP fish and myl7:Cre, myl7:H2B-GFP siblings, heat-shocked daily from 1 to 7 dpi. n (hearts) = 16 (myl7:Cre, myl7:H2B-GFP), 10 (myl7:Cre, hs:L to Axin1-nT, myl7:H2B-GFP). Error bars represent CI 95%. Unpaired Welch's unequal variances t-test. (E) Tomato, GFP and PCNA immunostaining of 7 dpi hearts from myl7:Cre, hs:L to Axin1-nT, myl7:H2B-GFP fish, heat-shocked daily from 1 to 7 dpi. White arrowheads point to PCNA+nT—GFP+ cardiomyocytes, yellow arrowheads point to PCNA—nT+GFP+ cardiomyocytes. Scale bars, 100 μm (overview), 10 μm (magnification). (F) Quantification of PCNA+nT—GFP+/nT—GFP+ and PCNA+nT+GFP+/nT+GFP+ borderzone cardiomyocytes of cryoinjured hearts from myl7:Cre, hs:L to Axin1-nT, myl7:H2B-GFP fish, heat-shocked daily from 1 to 7 dpi. n (hearts) = 7. Paired t-test. |
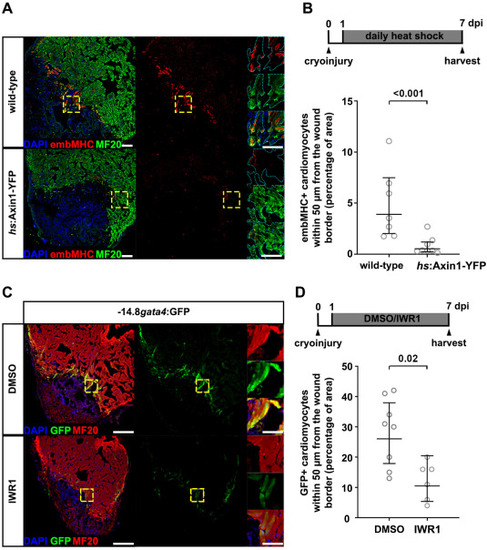
Fig. 6. Inhibition of Wnt/β-catenin signaling prevents cardiomyocyte dedifferentation. (A) embMHC and MF20 immunostaining on cryoinjured hearts of hs:Axin1-YFP fish and wild-type siblings, heat-shocked daily from 1 to 7 dpi. n (hearts) = 7 (wild-type), 8 (hs:Axin1-YFP). In the magnified view, the cyan dotted lines represent the outline of the MF20+ cardiomyocyte area. Scale bars, 100 μm (overview), 10 μm (magnification). (B) Quantification of the embMHC+MF20+/MF20+ area in the 50 μm wound borderzone of images shown in (A). Error bars represent CI 95%. Unpaired Welch's unequal variances t-test. (C) MF20 and GFP immunostaining on cryoinjured hearts of −14.8gata4:GFP fish treated with DMSO or IWR1 from 1 to 7 dpi. n = 8 (DMSO), 6 (IWR1). Scale bars, 100 μm (overview), 10 μm (magnification). (D) Quantification of GFP+MF20+/MF20+ area in the 50 μm wound borderzone of images shown in (C). Error bars represent CI 95%. Unpaired Welch's unequal variances t-test. |
Reprinted from Developmental Biology, 481, Bertozzi, A., Wu, C.C., Hans, S., Brand, M., Weidinger, G., Wnt/β-catenin signaling acts cell-autonomously to promote cardiomyocyte regeneration in the zebrafish heart, 226-237, Copyright (2021) with permission from Elsevier. Full text @ Dev. Biol.