
- Title
-
Gamma-Aminobutyric Acid (GABA) Promotes Growth in Zebrafish Larvae by Inducing IGF-1 Expression via GABAA and GABAB Receptors
- Authors
- Athapaththu, A.M.G.K., Molagoda, I.M.N., Jayasooriya, R.G.P.T., Choi, Y.H., Jeon, Y.J., Park, J.H., Lee, B.J., Kim, G.Y.
- Source
- Full text @ Int. J. Mol. Sci.

GABA promotes growth rate in zebrafish larvae through upregulation of growth-stimulating gene expression. Zebrafish larvae (n = 20) at three days post-fertilization (dpf) were treated with the indicated concentrations of GABA (0?50 mM). (A) Total body length was measured at 6, 9, and 12 dpf using a stereomicroscope (�4). ?-Glycerophosphate (GP) at 4 mM was used as a positive control. (B) Graphs represent the total body length corresponding to each dpf. (C) Total mRNA was extracted at 9 dpf, and reverse transcription-polymerase chain reaction was performed to measure the expression of insulin-like growth factor 1 (zIGF-1), growth hormone 1 (zGH-1), growth hormone receptor 1 (zGHR-1), and cholecystokinin A (zCCKA) genes. z?-Actin was used as an internal control. Densitometry analysis was conducted to determine the expression level of each gene and expressed relative to that of ?-actin (bottom). Significant differences among the groups were determined using one-way ANOVA followed by Bonferroni correction. All data are presented as mean � standard error of the mean (* p < 0.05, ** p < 0.01, and *** p < 0.001 vs. untreated zebrafish larvae). |
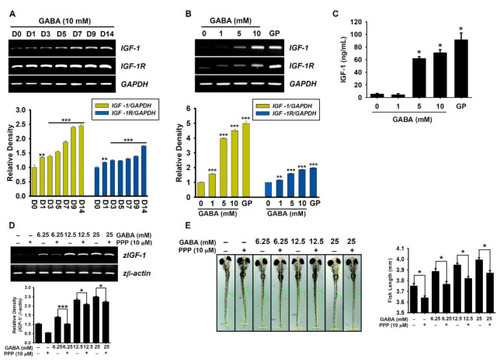
GABA enhances IGF-1 release, leading to an increase in growth rate via IGF-1R. (A) Preosteoblast MC3T3-E1 cells (1 � 104 cells/mL) were treated with 10 mM GABA for 14 days (D), and the media were replaced every three days with GABA. (B) In a parallel experiment, MC3T3-E1 cells were treated with GABA (0?10 mM) and 2 mM ?-glycerophosphate (GP) for seven days. Total RNA was extracted at the indicated time points, and cDNA was synthesized. RT-PCR was performed to determine the expression level of IGF-1 and IGF-1R. Glyceraldehyde 3-phosphate dehydrogenase gene (GAPDH) was used as an internal control. The expression of IGF-1 and IGF-1R relative to that of GAPDH level was determined (bottom). (C) To evaluate extracellular IGF-1 release, MC3T3-E1 cells (1 � 104 cells/mL) were treated with GABA (0?10 mM) and 2 mM GP for seven days. Cell culture media were collected, and colorimetric enzyme-linked immunosorbent assay (ELISA) was performed. (D,E) Zebrafish larvae (n = 20) at three days post-fertilization (dpf) were pretreated with 10 �M picropodophyllin (PPP) 2 h before treatment with GABA (0?25 mM). (D) RT-PCR was performed to determine the expression of IGF-1. The expression of IGF-1 relative to that of z?-actin level was determined (bottom). (E) Total body length was measured at 9 dpf using a stereomicroscope (�4). Graph represents the total body length of zebrafish larvae (right). Significant differences among the groups were determined using Student?s t-test and one-way ANOVA followed by Bonferroni correction. All data are presented as mean � standard error of the mean (* p < 0.05, ** p < 0.01, and *** p < 0.001). |

GABAA and GABAB receptors are responsible for GABA-mediated growth promotion in zebrafish larvae. Zebrafish larvae (n = 20) at three days post-fertilization (dpf) were pretreated with 10 �M each of (A) bicuculline (GABAA antagonist), (B) CGP 46381 (GABAB antagonist), and (C) TPMPA (GABAC antagonist) 2 h before treatment with 25 mM GABA. The media were replaced at 6 dpf with GABA, and total body length was measured at 9 dpf. Graphs represent the total body length (bottom). Significant differences among the groups were determined using Student?s t-test. All data are presented as mean � standard error of the mean (** p < 0.01 and *** p < 0.001). N.S., non-significant. |

GABA upregulates growth-stimulating gene expression via GABAA and GABAB receptors. Zebrafish larvae (n = 20) at three days post-fertilization (dpf) were treated with 10 �M of each (A) bicuculline, (B) CGP 46381, and (C) TPMPA 2 h before treatment with 25 mM GABA, and total RNA was extracted at 9 dpf. The RNA was reverse-transcribed, and synthetic cDNA was amplified to determine expression of the genes for insulin-like growth factor 1 (zIGF-1), growth hormone 1 (zGH-1), growth hormone receptor 1 (zGHR-1), and cholecystokinin A (zCCKA). z?-Actin was used as an internal control. Densitometry analysis was conducted to determine the expression level of each gene relative to that of ?-actin and illustrated (bottom). Significant differences among the groups were determined using Student?s t-test. All data are presented as mean � standard error of the mean (*** p < 0.001). N.S., non-significant. |
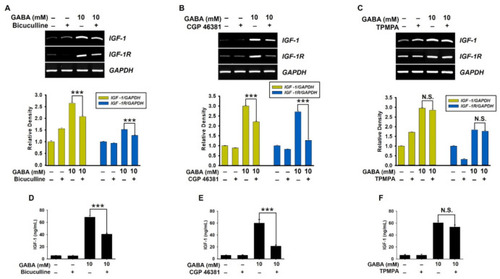
Inhibition of GABAA and GABAB receptors downregulates GABA-mediated IGF-1 and IGF-1R expression in preosteoblast MC3T3-E1 cells. MC3T3-E1 cells (1 � 104 cells/mL) were treated with 5 �M each of (A,D) bicuculline, (B,E) CGP 46381, and (C,F) TPMPA 2 h before treatment with 10 mM GABA for seven days. Total RNA was extracted, and RT-PCR was performed to determine the expression level of IGF-1 and IGF-1R. Glyceraldehyde 3-phosphate dehydrogenase gene (GAPDH) was used as an internal control. The expression of IGF-1 and IGF-1R relative to that of GAPDH level was determined (bottom). In a parallel experiment, cell-free supernatants were collected, and ELISA was conducted. Significant differences among the groups were determined using Student?s t-test. All data are presented as mean � standard error of the mean (*** p < 0.001). N.S., non-significant. |