
- Title
-
The presynaptic glycine transporter GlyT2 is regulated by the Hedgehog pathway in vitro and in vivo
- Authors
- de la Rocha-Muñoz, A., Núñez, E., Vishwanath, A.A., Gómez-López, S., Dhanasobhon, D., Rebola, N., López-Corcuera, B., de Juan-Sanz, J., Aragón, C.
- Source
- Full text @ Commun Biol
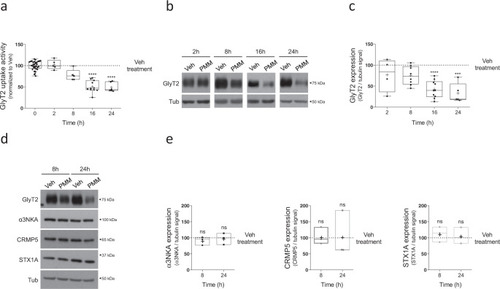
a Primary brainstem and spinal cord neurons were treated with 10 µM purmorphamine at the indicated times and glycine transport rates were measured using [3H]-glycine transport assays. Glycine transport shown is normalized against control conditions. ****p (PMM 16 h) < 0.0001, ****p (PMM 24 h) < 0.0001, using Dunn’s multiple comparisons test, Number of experiments n (Veh & PMM 2 h) = 5, n = (Veh & PMM 8 h) = 5, n (Veh & PMM 16 h) = 11, n (Veh & PMM 24 h) = 6. b Representative immunoblot of primary brainstem and spinal cord neuronal cultures. Cells were treated with 10 µM purmorphamine for the times indicated. Tubulin is used as protein loading control. Veh: DMSO. c Quantification is shown normalized to the corrected signal in the control in each case (Veh). ****p (PMM 16 h) < 0.0001, ***p (PMM 24 h) = 0.0002, using Dunn’s multiple comparisons test, number of experiments n (Veh & PMM 2 h) = 4, n = (Veh & PMM 8 h) = 8, n (Veh & PMM 16 h) = 10, n (Veh & PMM 24 h) = 5. d Neurons were treated with the vehicle alone or with 10 µM purmorphamine and the expression of the following GlyT2-associated/related proteins was assessed: α3NKA, CRMP5, and syntaxin1A (STX1A). Tubulin is used as protein loading control. e Box plots show quantification of protein expression changes during 8 and 16 h PMM treatment measured by western blots performed as in Fig. 1d. Data are normalized to the corrected signal in the control in each case (Veh). nsp (αNKA: PMM 8 h) = 0.7260, nsp (αNKA: PMM 24 h) > 0.9999, nsp (CRMP5: PMM 8 h) > 0.9999, nsp (CRMP5: PMM 24 h) > 0.9999, nsp (STX1A: PMM 8 h) = 0.7260, nsp (STX1A: PMM 24 h) > 0.9999, using Dunn’s multiple comparisons test, number of experiments n = 3. PMM purmorphamine |
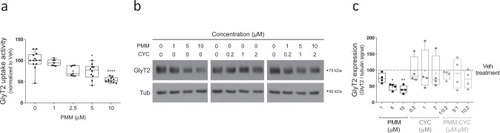
a Primary brainstem and spinal cord neurons were treated with the concentrations of purmorphamine indicated for 16 h and glycine transport rates were measured using [3H]-glycine transport assays. Glycine transport shown is normalized against control conditions. *p (PMM 5 μM) = 0.0242, ****p (PMM 10 μM) < 0.0001, using Dunn’s multiple comparisons test, n (Veh) = 13, number of experiments n (PMM 1 μM) = 7, n (PMM 2.5 μM) = 7, n (PMM 5 μM) = 10, n (PMM 10 μM) = 10. b Representative immunoblot of primary brainstem and spinal cord neurons. Cells were treated with purmorphamine or/and cyclopamine at the concentrations indicated and the expression of GlyT2 was analyzed by immunoblotting after 16 h. Tubulin is used as protein loading control. c Quantification of GlyT2 expression is normalized to the corrected signal against tubulin. *p (Veh vs PMM 5 μM) = 0.0248, **p (Veh vs PMM 10 μM) = 0.0098, nsp (Veh vs PMM 1 μM + CYC 0.2 μM) > 0.9999, nsp (Veh vs PMM 5 μM + CYC 1 μM) > 0.9999, nsp (Veh vs PMM 10 μM + CYC 2 μM) > 0.9999, using Dunn’s multiple comparisons test; number of experiments n = 4. PMM purmorphamine, CYC cyclopamine. |
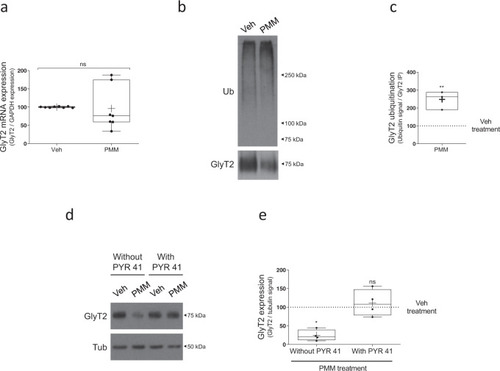
a Neurons were treated with 10 µM purmorphamine or vehicle for 16 h. Relative GlyT2 mRNA levels were determined by qPCR using glyceraldehyde-3-phosphate dehydrogenase (GAPDH) as housekeeping gene (arbitrary units). ns = not significantly different using Mann–Whitney test, n = 7. b Neurons were treated with purmorphamine as described in a. GlyT2 was immunoprecipitated and ubiquitination of the transporter was assayed by immunoblotting with anti-ubiquitin antibody. Blots were probed against GlyT2 to normalize ubiquitination signal against the amount of GlyT2 immunoprecipitated in each case to correct for GlyT2 protein expression. c Quantification of GlyT2 ubiquitination normalized to the control (vehicle). **p = 0.0074, using unpaired t-test, n = 3. d Neurons were treated with purmorphamine as described in a. and in the presence or absence of 5 µM PYR41. Tubulin is used as protein loading control. e Quantification of GlyT2 expression was normalized against tubulin. *p (Veh vs PMM) = 0.0164, nsp (Veh vs PMM + PYR41) > 0.9999 using Kruskal–Wallis test, n = 4. PMM purmorphamine. |
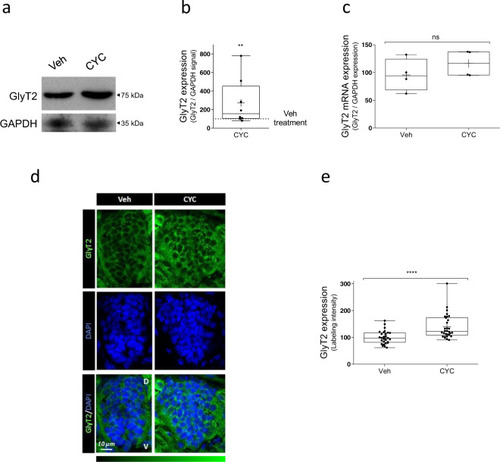
a Representative immunoblot of 48 hpf zebrafish embryos. Twenty-four hpf embryos were incubated with 100 µM cyclopamine or with vehicle alone (4 embryos per point) for 24 h and the expression of GlyT2 was analyzed by immunoblotting. GAPDH is used as protein loading control. b Quantification of GlyT2 expression is normalized to the corrected signal against GAPDH. **p (Veh vs CYC 100 μM) = 0.0014, using Kolmogorov–Smirnov test, n = 8. c Relative mRNA levels of GlyT2 in 24 hpf zebrafish embryos treated with 100 µM cyclopamine for 24 h were determined by qPCR using glyceraldehyde-3-phosphate dehydrogenase (GAPDH) as housekeeping gene (arbitrary units). n.s. = not significantly different using Mann–Whitney U test, n = 4. CYC cyclopamine. d Dechorionated 48 hpf zebrafish embryos treated as in a. were fixed in 4% PFA and embedded in OCT cryostat embedding medium. Ten micrometer spinal cord transversal sections were incubated with anti-GlyT2 antibody (green) and DAPI (blue). e Quantification of GlyT2 fluorescence intensity. ****p < 0.0001, using Mann–Whitney U test, n (Veh) = 29, n (CYC) = 30. CYC cyclopamine, D dorsal, V ventral. |