
|
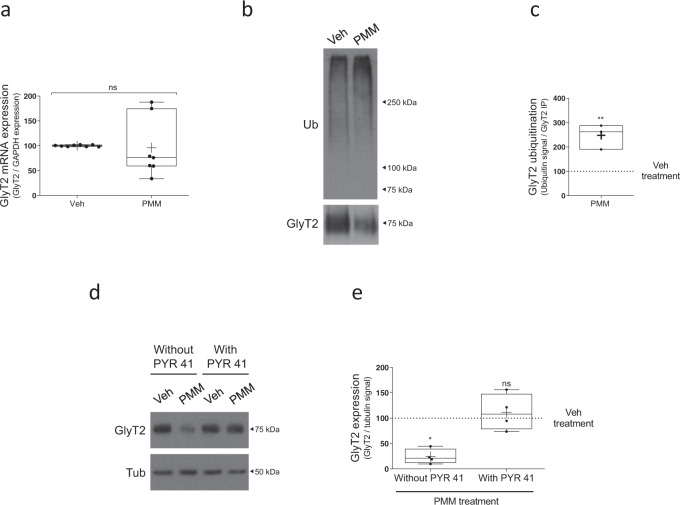
Fig. 3 a Neurons were treated with 10 µM purmorphamine or vehicle for 16 h. Relative GlyT2 mRNA levels were determined by qPCR using glyceraldehyde-3-phosphate dehydrogenase (GAPDH) as housekeeping gene (arbitrary units). ns = not significantly different using Mann–Whitney test, n = 7. b Neurons were treated with purmorphamine as described in a. GlyT2 was immunoprecipitated and ubiquitination of the transporter was assayed by immunoblotting with anti-ubiquitin antibody. Blots were probed against GlyT2 to normalize ubiquitination signal against the amount of GlyT2 immunoprecipitated in each case to correct for GlyT2 protein expression. c Quantification of GlyT2 ubiquitination normalized to the control (vehicle). **p = 0.0074, using unpaired t-test, n = 3. d Neurons were treated with purmorphamine as described in a. and in the presence or absence of 5 µM PYR41. Tubulin is used as protein loading control. e Quantification of GlyT2 expression was normalized against tubulin. *p (Veh vs PMM) = 0.0164, nsp (Veh vs PMM + PYR41) > 0.9999 using Kruskal–Wallis test, n = 4. PMM purmorphamine.