|
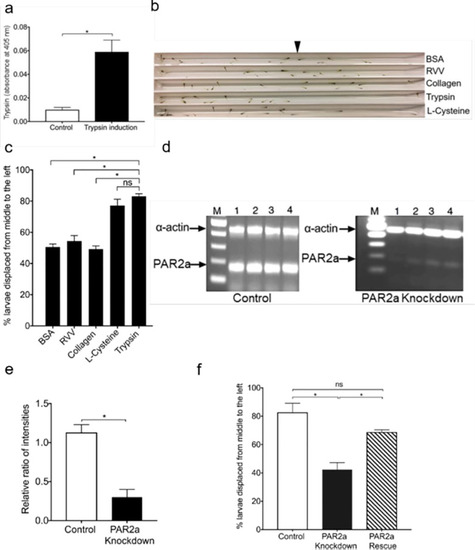
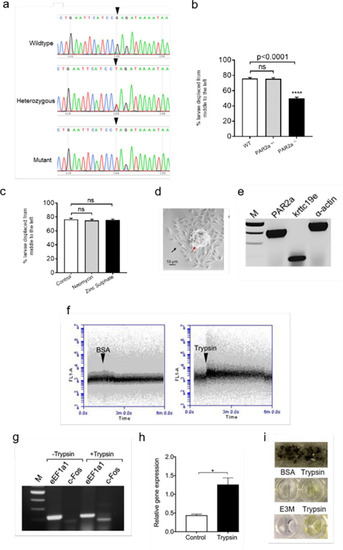
Knockout of <italic toggle='yes'>par2a</italic> and detection of cell type and the components that sense trypsin signaling.a. DNA sequences of par2a gene of the wild-type (top), heterozygous (middle), and homozygous knockout mutants (bottom) are shown as chromatograms. The arrowhead marks the mutation. Only sequences around the par2a gene mutation are shown. b. The relation between trypsin repelling results and par2a knockout mutants. Showing for each genotype (WT, wild-type; par2a+/ter, heterozygote; par2ater/ter, homozygous knockout) the percent of larvae displaced from the middle to the left of the mini-tank opposite to trypsin administration. c. Evidence that the trypsin-sensitive surface cells are not neuromast or olfactory cells. Comparison of intact larvae and larvae with neuromast cells ablated by neomycin treatment and olfactory cells inactivated by zinc sulphate. Similar percentages of larvae from three groups were displaced from the middle to the left, away from the source of trypsin, suggesting that neuromast cells and olfactory cells were not responsible for the repellent effect of trypsin. (n = 6 experiments; ns, non-significant). d. Phase-contrast image of skin cell culture. Red and black arrows show the scale and skin cells, respectively. e. Confirmation of keratinocytes. RT-PCR products of three genes par2a, krittc19e, and α-actin. M, DNA size markers. Positive amplification of krittc19e and par2a showed that they are keratinocytes having Par2a receptors. f. Calcium signaling in keratinocytes induced by trypsin. The left and right panels are the fluorescence shown by flow cytometry when induced by BSA and trypsin, respectively. g. Induction of c-fos transcripts by trypsin exposure of adult zebrafish. Photograph showing the RT-PCR products of the zebrafish brain RNAs that were not exposed to trypsin (-Trypsin) and were exposed to trypsin (+Trypsin). Lanes show M, DNA size markers, ef1-α labeled as eEF1a1 (internal control, and c-fos labeled as c-Fos. h. Quantification of the induction of c-fos transcripts by trypsin by real-time RT-PCR. The relative gene expression of c-fos in the control and trypsin-treated whole brain is given on the y-axis. i. Diffusion of trypsin through the fish skin mucus. In the photograph, the top panel shows mucus layered on the cheesecloth covering the well of the 96-well plate. The middle panel shows the yellow color generated by the cleavage of S-2238 by trypsin diffusion (Trypsin) compared to control (BSA). The bottom panel shows negative (E3M) and positive (Trypsin) control reactions performed in the wells.
EXPRESSION / LABELING:
|
Genes:
|
|
|
Fish:
|
|
|
Condition:
|
|
|
Anatomical Terms:
|
|
|
Stage:
|
Adult
|
|