FIGURE SUMMARY
Title

Authentication of a novel antibody to zebrafish collagen type XI alpha 1 chain (Col11a1a)

Authors
Reeck, J.C., Hardy, M.J., Pu, X., Keller-Peck, C., Oxford, J.T.
Source
Full text @ BMC Res. Notes

Model of Collagen type XI. A Collagen type XI molecule. Structural regions of the type XI collagen molecule are indicated including the signal peptide, amino terminal propeptide, variable region, the minor helix, the amino telopeptide, the major triple helix, the carboxy telopeptide, and the carboxy propeptide. Relative size and dimensions are shown above the molecular model. B Three alpha chains: α1(XI), α2(XI), and α3(XI). C Formation of triple helical molecule is initiated at the C-terminus. D Fully assembled triple helical collagen molecule with carboxyl propeptide. E Potential cleavage events, with carboxy propeptide removed, with amino propeptide removed at the BMP-1 cleavage site (35 kDa), and finally, with the ADAMTS2 cleavage site within the amino telopeptide indicated by the vertical dotted line that would release the major triple helix and generate a fragment containing the amino propeptide and variable region (100 kDa). F Exon structure of Col11a1a, indicating alternatively spliced isoforms. G Epitope sequence unique to the new antibody. This sequence is encoded by exon 5 which is present in all spliceforms. NTD amino terminal domain, Npp amino propeptide domain, VR variable region, mh minor helix, N-tp amino telopeptide, MH major triple helix, C-tp carboxy telopeptide, Cpp carboxy propeptide

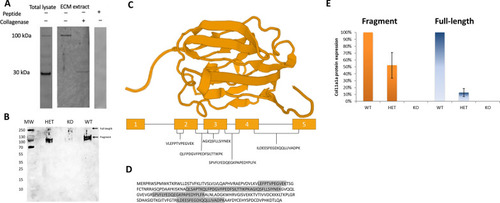
Antibody detection of Col11a1a protein by immunoblot and confirmed by mass spectrometry. A The antibody recognized protein bands migrating with apparent molecular weights of 100 and 35 kDa from 24 hpf zebrafish total lysate. Proteins extracted from the ECM contained the 100 kDa that was converted to a 35 kDa band upon treatment with collagenase. In the presence of a large excess of the peptide used as the antigen, the 100 kDa and 35 kDa bands from total lysate are not visible on the immunoblot, indicating competition by the peptide for the antigen binding site on the antibody. See Addiitonal file 1: Figure S1 for full length original unprocessed blots. B Representative immunoblot of proteins extracted from wildtype, heterozygous, and homozygous knockout zebrafish. The 100 kDa fragment of Col11a1a is apparent in lysate from 72 hpf zebrafish with quantitatively minor bands at the position of full-length Col11a1a. C Structural model of the amino propeptide domain of Col11a1a. Peptides detected by mass spectrometry are indicated in their respective locations of the exons encoding the protein. D Protein sequence of Col11a1a amino propeptide domain with grey shading indicates the sequence coverage used to confirm the identity of the protein recognized by the new antibody as Col11a1a. E Quantification of immunoblot band intensity from proteins extracted from wildtype (WT), heterozygotes, and homozygous knockout embryos. The NTD fragment and full-length molecule were quantified from three individual blots by densitometry, calculating average and standard deviation. Absence of these protein bands from homozygous knockout embryos confirmed specificity of the new antibody. WT wildtype, HET heterozygous, KO knockout, MW molecular weight markers

EXPRESSION / LABELING:
Gene:
Antibody:
Fish:
Anatomical Term:
Stage Range: Prim-5 to Protruding-mouth
PHENOTYPE:
Fish:
Observed In:
Stage: Protruding-mouth

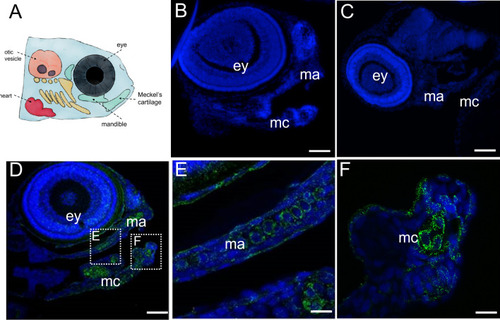
Immunohistochemistry demonstrating location of Col11a1a within developing craniofacial region at 72 hpf. Wildtype zebrafish embryos were fixed, embedded, and sectioned for immunofluorescence detection of Col11a1a using the new primary antibody. A Schematic representation of the craniofacial region of zebrafish. B Negative control using pre-immune serum in place of primary antibody. C Negative control omitting primary antibody. D Col11a1a primary antibody (green) detects Col11a1a in the eye and within the jaw cartilage elements represented by the mandible (ma) and Meckel’s cartilage (mc). DAPI (blue) staining indicates the location of cell nuclei. Dotted square frames indicate location of higher magnification images of mandibular cartilage shown in E and Meckel’s cartilage shown in F. Scale bars B 50 µm; C 50 µm; D 50 µm; E 250 µm; F 250 µm. Results are representative of staining pattern found in 15 individual embryos

EXPRESSION / LABELING:
Gene:
Antibody:
Fish:
Anatomical Terms:
Stage: Protruding-mouth
Acknowledgments
This image is the copyrighted work of the attributed author or publisher, and ZFIN has permission only to display this image to its users. Additional permissions should be obtained from the applicable author or publisher of the image. Full text @ BMC Res. Notes