FIGURE SUMMARY
Title

Mycobacteriophage-antibiotic therapy promotes enhanced clearance of drug-resistant Mycobacterium abscessus

Authors
Johansen, M.D., Alcaraz, M., Dedrick, R.M., Roquet-Banères, F., Hamela, C., Hatfull, G.F., Kremer, L.
Source
Full text @ Dis. Model. Mech.

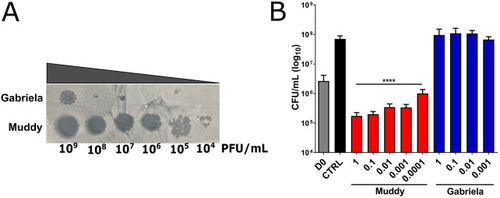
Specificity and killing activity of mycobacterial phages against GD01. (A) Plaque assay. Tenfold serial dilutions of phages Gabriela and Muddy were spotted on a lawn of GD01 grown on 7H10OADC/CaCl2. Lysis was observed after 5 days. PFU, plaque-forming units. (B) Killing assay. GD01 was grown in 7H9OADC, incubated with the various phages for 5 days at 37°C and plated on LB agar prior to colony-forming unit (CFU) counting. D0, GD01 inoculum; CTRL, GD01 without phages. ****P<0.0001 (unpaired Student's t-test). Data shown are the mean of three independent experiments±s.d.

In vitro killing activity of Muddy and antibiotics against GD01. (A-H) GD01 was grown in CaMHB at 37°C and incubated with Muddy (MOI=0.0001) in the absence or presence of different antibiotics used in clinical settings. Three drug concentrations were used (in µg/ml) at sub-MIC doses. After 5 days of treatment, bacteria were plated on LB agar prior to CFU counting. D0, GD01 inoculum; CTRL, GD01 without phages. *P<0.05; **P<0.01; ***P<0.001; ****P<0.0001 (unpaired Student's t-test). Data shown are the mean of three independent experiments±s.d.

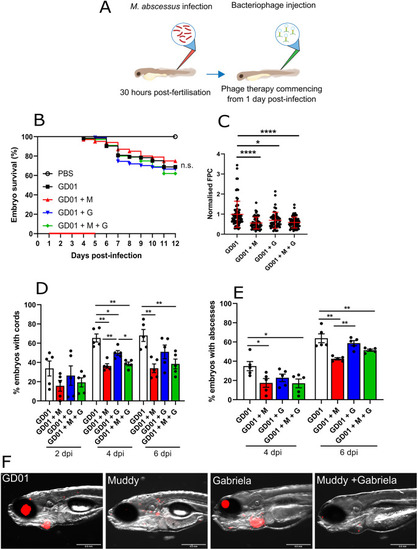
Impact of bacteriophage Muddy on GD01 infection in wild-type zebrafish. At 30 hpf, embryos were infected with 250-300 CFU of GD01 expressing tdTomato via caudal vein injection. At 1 dpi, embryos commenced phage therapy through caudal vein administration at an MOI of 50:1 (phage:bacteria) based on the initial bacterial infection inoculum. Embryos were treated daily from 1 dpi up to and including 5 dpi with either Muddy (M), Gabriela (G) or a phage cocktail containing both Muddy and Gabriela (M+G). (A) A generalised schematic showing the experimental design corresponding to the figure. (B) Embryo survival was monitored over a 12 day period, with embryos counted daily. Survival curves were analysed using the log-rank (Mantel–Cox) statistical test. The red bar across the x-axis indicates the duration of daily phage administration in the current experiment. (C) Bacterial burden [fluorescent pixel count (FPC)] was analysed at 6 dpi using fluorescent microscopy. Fluorescent images were analysed in ImageJ using the ‘Analyze particles’ function. Bacterial burden was analysed using a Kruskal–Wallis one-way ANOVA. (D,E) The proportion of embryos with cords (D) and abscesses (E) was enumerated at 2, 4 and 6 dpi using fluorescent microscopy. Abscess and cord quantification was analysed using a Kruskal–Wallis one-way ANOVA. Data shown are the mean of three independent experiments±s.d. (n=20-30 per group for each experiment). (F) Representative zebrafish images of untreated (GD01) or phage-treated embryos at 6 dpi, showing the presence of extracellular bacterial cords. Red overlay represents GD01 expressing TdTomato. Scale bars: 0.5 mm. n.s., not significant; *P<0.05; **P<0.01; ****P<0.0001.

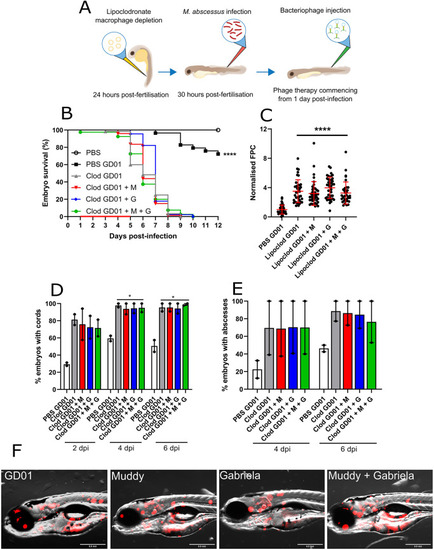
Activity of Muddy in GD01-infected zebrafish lacking macrophages. At 24 hpf, embryos were micro-injected with either PBS liposomes (PBS) or lipoclodronate-filled liposomes (Clod) to achieve macrophage depletion. At 30 hpf, treated embryos were infected with 250-300 CFU of GD01 (PBS GD01 and Clod GD01) via caudal vein injection. At 1 dpi, embryos commenced phage therapy through caudal vein injection at an MOI of 50:1 (phage:bacteria) based on initial bacterial infection inoculum. Embryos were treated daily from 1 dpi, up to and including 5 dpi with Muddy (M), Gabriela (G) or a phage cocktail containing both Muddy and Gabriela (M+G). (A) A generalised schematic showing the experimental design corresponding to the figure. (B) Embryo survival was monitored over a 12 day period, with embryos counted daily. Survival curves were analysed using the log-rank (Mantel–Cox) statistical test. The red bar across the x-axis indicates the duration of daily phage administration in the current experiment. (C) Bacterial burden (FPC) was analysed at 6 dpi using fluorescent microscopy. Fluorescent images were analysed in ImageJ using the ‘Analyze particles’ function. Bacterial burden was analysed using a Kruskal–Wallis one-way ANOVA. (D,E) The proportion of embryos with cords (D) and abscesses (E) was enumerated at 2, 4 and 6 dpi using fluorescent microscopy. Abscess and cord quantification was analysed using a Kruskal–Wallis one-way ANOVA. Data shown are the mean of two independent experiments±s.d. (n=20-30 per group for each experiment). (F) Representative zebrafish images of untreated (GD01) or phage-treated embryos at 6 dpi, showing the presence of extracellular bacterial cords. Red overlay represents GD01 expressing TdTomato. Scale bars: 0.5 mm. *P<0.05; ****P<0.0001.

Effect of Muddy in GD01-infected cftr morphants. At the one- to four-cell stage, fertilised zebrafish eggs were injected in the nucleus with either control morpholino (control) or cftr morpholino (cftr). At 30 hpf, embryos were infected with 250-300 CFU of GD01 (control GD01 or cftr GD01) via caudal vein injection. At 1 dpi, embryos commenced phage therapy through caudal vein injection at an MOI of 50:1 (phage:bacteria) based on initial bacterial infection inoculum. Embryos were treated daily from 1 dpi, up to and including 5 dpi with Muddy (M), Gabriela (G) or a phage cocktail containing both Muddy and Gabriela (M+G). (A) A generalised schematic showing the experimental design corresponding to the figure. (B) Embryo survival was monitored over a 12 day period, with embryos counted daily. Survival curves were analysed using the log-rank (Mantel–Cox) statistical test. The red bar across the x-axis indicates the duration of daily phage administration in the current experiment. (C) Bacterial burden (FPC) was analysed at 6 dpi using fluorescent microscopy. Fluorescent images were analysed in ImageJ using the ‘Analyze particles’ function. Bacterial burden was analysed using a Kruskal–Wallis one-way ANOVA. (D,E) The proportion of embryos with cords (D) and abscesses (E) was enumerated at 2, 4 and 6 dpi using fluorescent microscopy. Abscess and cord quantification was analysed using a Kruskal–Wallis one-way ANOVA. Data shown are the mean of three independent experiments±s.d. (n=20-30 per group for each experiment). (F) Representative cftr morphant images of untreated (GD01) or phage-treated embryos at 6 dpi, showing the presence of extracellular bacterial cords or localised infection. Red overlay represents GD01 expressing TdTomato. Scale bars: 0.5 mm. *P<0.05; **P<0.01; ***P<0.001; ****P<0.0001.

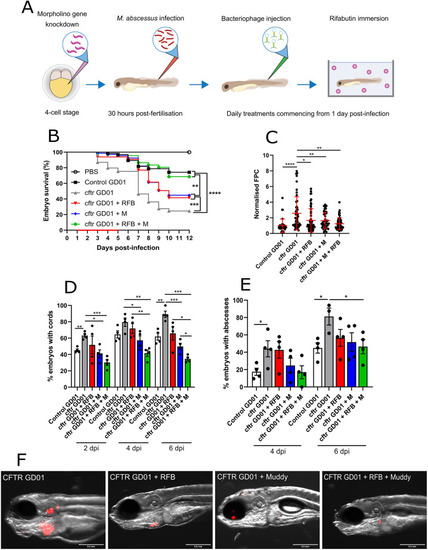
Activity of Muddy and rifabutin in GD01-infected cftr morphants. At the one- to four-cell stage, fertilised zebrafish eggs were injected in the nucleus with either control morpholino (control) or cftr morpholino via caudal vein injection. At 1 dpi, embryos commenced phage Muddy (M) and/or rifabutin (RFB) therapy through caudal vein injection at an MOI of 50:1 (phage:bacteria) based on initial bacterial infection inoculum. Embryos were treated daily from 1 dpi, up to and including 5 dpi with Muddy. RFB was added to zebrafish water daily at a final concentration of 50 µg/ml. (A) A generalised schematic showing the experimental design corresponding to the figure. (B) Embryo survival was monitored over a 12 day period, with embryos counted daily. Survival curves were analysed using the log-rank (Mantel–Cox) statistical test. The red bar across the x-axis indicates the duration of daily phage and RFB administration in the current experiment. (C) Bacterial burden (FPC) was analysed at 6 dpi using fluorescent microscopy. Fluorescent images were analysed in ImageJ using the ‘Analyze particles’ function. Bacterial burden was analysed using a Kruskal–Wallis one-way ANOVA. (D,E) The proportion of embryos with cords (D) and abscesses (E) was enumerated at 2, 4 and 6 dpi using fluorescent microscopy. Abscess and cord quantification was analysed using a Kruskal–Wallis one-way ANOVA. Data shown are the mean of three independent experiments±s.d. (n=20-30 per group for each experiment). (F) Representative cftr morphant images of embryos left untreated (GD01), treated with Muddy alone, RFB alone or with Muddy plus RFB at 6 dpi, showing the presence of extracellular bacterial cords or localised infection. Red overlay represents GD01 expressing TdTomato. *P<0.05; **P<0.01; ***P<0.001; ****P<0.0001.

Acknowledgments
This image is the copyrighted work of the attributed author or publisher, and ZFIN has permission only to display this image to its users. Additional permissions should be obtained from the applicable author or publisher of the image. Full text @ Dis. Model. Mech.