
- Title
-
Enhancement and Segmentation Workflow for the Developing Zebrafish Vasculature
- Authors
- Kugler, E., Plant, K., Chico, T., Armitage, P.
- Source
- Full text @ J Imaging

Dorsal cranial volume was measured in the region indicated by white outlines. (A) Dorsal-to-ventral boundary was established during image acquisition. (B) Lateral boundaries were defined by user to exclude structures outside the ROI, such as the eyes (asterisk). Figure reproduced with permission from [13] under licence 4466480468142. |
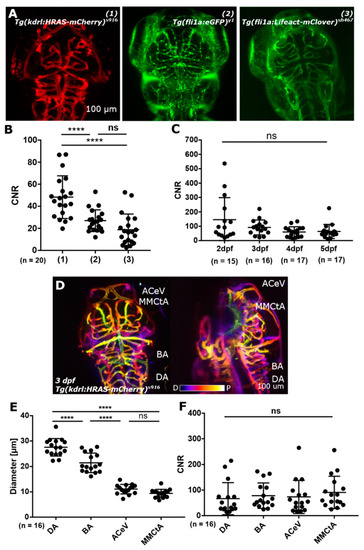
(A) Image quality was assessed by contrast-to-noise ratio (CNR) level measurement in three different transgenic lines, which harbour different reporter constructs (promotor as well as reporter; 1,2,3). (B) CNR levels in these transgenic reporter lines showed a statistically significant difference between (1) and (2) as well as between (1) and (3), with p < 0.0001 (****) for both. Between (2) and (3) no statistically significant difference was found (p 0.0898; ns). (C) CNR levels from 2-to-5 dpf showed no statistically significant difference (p 0.1032; ns). (D) Light sheet fluorescence microscopy (LSFM) allows to visualize vessels from the most dorsal plane (p - proximal image plane; e.g., anterior cerebral vein (ACeV)) to vessels which are a few hundred micrometer inside the embryo (d distal image plane; e.g., dorsal aorta (DA)). (E) Vessels in the dorsal cranial zebrafish vasculature with different diameters show no statistically significant difference in CNR levels ((F); p 0.3007 (ns); Figures (A) and (D) reproduced with permission from [13] under licence 4466480468142.). |

(A) Samples were embedded in an agarose block for LSFM. (B–D) Motion correction for the transgenic Tg(kdrl:HRAS-mCherry)s916 was previously tested [13]. (E,F) Application of the same motion correction approach to the transgenic Tg(fli1a:eGFP)y1 delivered a similar level of artefact correction (p 0.0008; ***). Figure (D) reproduced with permission from [13] under licence 4466480468142. |

(A) Original data sometimes suffered from dimly visualized vessels (blue arrowhead) and had a double-peak cross-vessel intensity distribution (red arrowhead), which was particularly pronounced in bigger vessels. (B) Application of General Filtering (GF) failed to enhance dim vessels. (C) Application of Tubular Filtering (TF) successfully enhanced dim vessels and extracted vessels with double-peak intensity distributions as one segment (red arrowhead). (D) Assessment of the cross-vessel intensity distribution showed that the original double-peak distribution (black line; averages of n = 12 embryos) was successfully converted into a single-peak when scale reached vessel size (e.g., 9.3604 or 10.6848), while larger scales were found to reduce central intensity and blur vessel edges (e.g., 15.359 and above). This was further validated by visual investigation (E,F) where the TF response is shown in green overlaid onto the original image in red. |

(A) Readily implemented segmentation methods of the Fiji image analysis software were applied to images after pre-processing using GF. (B) It was found that intensity-based Otsu-thresholding delivered the most robust results in comparison to other methods, such as k-means clustering ((C); red asterisks: vessels not extracted), SRM (D), or fast-marching level set (E). (F) The same segmentation methods were applied to images after vessel enhancement with TF. Again, it was found that intensity-based Otsu-thresholding delivered the most reliable results (G). While k-means clustering (H), SRM (I), and the tested fast-marching level set implementation (J) resulted in an unsatisfactory segmentation. (K) Vascular volume quantification after GF showed no statistically significant difference between the tested segmentation methods. (L) Quantification of the vascular volume after TF showed a statistically significant difference between the assessed segmentation methods. Namely, TF Otsu vs. TF k-means p 0.0293, TF Otsu vs. TF SRM 0.0058, and TF k-means vs. TF SRM p > 0.9999. CoV was found to be lower after TF with 15.24% k-means and 30.00% SRM and only 10.71% Otsu-thresholding (n = 7, Mann-Whitney U test; representative images). |