FIGURE SUMMARY
Title

Pigment pattern morphospace of Danio fishes: evolutionary diversification and mutational effects

Authors
McCluskey, B.M., Liang, Y., Lewis, V.M., Patterson, L.B., Parichy, D.M.
Source
Full text @ Biol. Open

Diverse pigment patterns of Danio species. Shown are close-ups of pattern elements across eleven Danio species. Symbols next to species names denote overall pattern classes with colors and shapes corresponding to those in figures below. Gray shapes at nodes indicate the most likely pattern at that node based on ancestral state reconstruction (see Fig. S1) or preponderance of pattern in outgroup species (root node). Shapes separated by arrows indicate transitions away from predicted ancestral patterns. Cladogram based on relationships recovered in McCluskey and Postlethwait (2015).

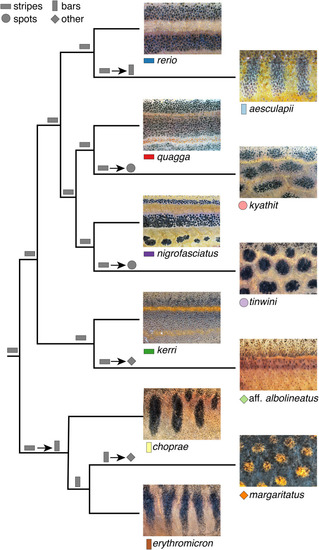
Species pattern variation. Panels show typical wild-type phenotypes within species and illustrate the regions of interest and greyscale conversions used for analyses. Left two columns show females, right two columns show males.

Metrics for describing pattern variation. (A) Entropies for patterns of individual wild-type fish measured along the DV axis (stripe entropy, EDV) and AP axis (bar entropy, EAP) with each point representing the mean entropies across transects within a single fish. Species symbols correspond to Fig. 1. Dashed line denotes equal stripe and bar entropy. The plot reveals broad pattern types (e.g. stripes above dashed line, bars right of dashed line) and species-differences in pattern space. (B) Pattern strength (σ) and orientation (Ω) also distinguished among pattern types (e.g. bars at right, stripes at left). Dashed line denotes patterns with similar horizontal and vertical contributions. (C) Species patterns are more dispersed in the morphospace defined by stripe variation (VDV) and bar variation (VAP) compared to the other morphospaces. Dashed line denotes equal stripe and bar pattern. (D) Species are best delimited in a higher dimensional space derived from all six pattern metrics. Shown are the species plotted against the first two canonicals resulting from a discriminant analysis using all six pattern metrics. Loadings of metrics along the first two canonicals are shown.

Multivariate pattern space separates pattern types and species. Shown are two views of pattern space represented in three-dimensions, as described by combinations of six pattern metrics (EAP, EDV, Ω, σ, VAP, VDV). Bubbles show 95% confidence intervals. Discriminant analyses indicated significant predictive power for each metric (all P<0.0001) and classified 96% of individuals correctly to species.

Effects of kita, ltk, and csf1ra mutation across species. (A) Pattern phenotypes of wild-type and mutant D. rerio, D. aesculapii, and D. aff. albolineatus. Boxed regions are shown at higher magnification in inset, illustrating yellow-orange xanthophores, or their absence in csf1ra mutants. Arrowheads denote iridescent iridophores, missing in ltk mutants. (B–E) Transitions in morphospace resulting from single locus mutations. In each plot, arrows point from the wild type of each species to its corresponding mutant. (B) Effects of csf1ra mutation on pattern strength and orientation in three Danio species. (C) Effects of kita mutation on pattern strength and orientation in three Danio species. (D) Effects of ltk mutation on pattern strength and orientation in two Danio species.

Entropy scores reveal anterior–posterior differences in csf1ra mutant phenotypes. (A) Representative wild-type and csf1ra mutant D. rerio illustrating regions of interest. (B) Stripe entropy scores (mean±s.e.) did not differ between anterior and posterior regions of wild-type, were reduced in csf1ra mutants overall, but especially in the posterior (genotype x region interaction, F1,36=16.6, P=0.0002; reciprocal values pf EDV were analyzed to control for differences in residual variance among groups). Shared letters above symbols indicate means not significantly different from one another (P>0.05) in Tukey-Kramer post hoc comparisons.

Acknowledgments
This image is the copyrighted work of the attributed author or publisher, and ZFIN has permission only to display this image to its users. Additional permissions should be obtained from the applicable author or publisher of the image. Full text @ Biol. Open