
Fig. 3.
- ID
- ZDB-IMAGE-211007-64
- Publication
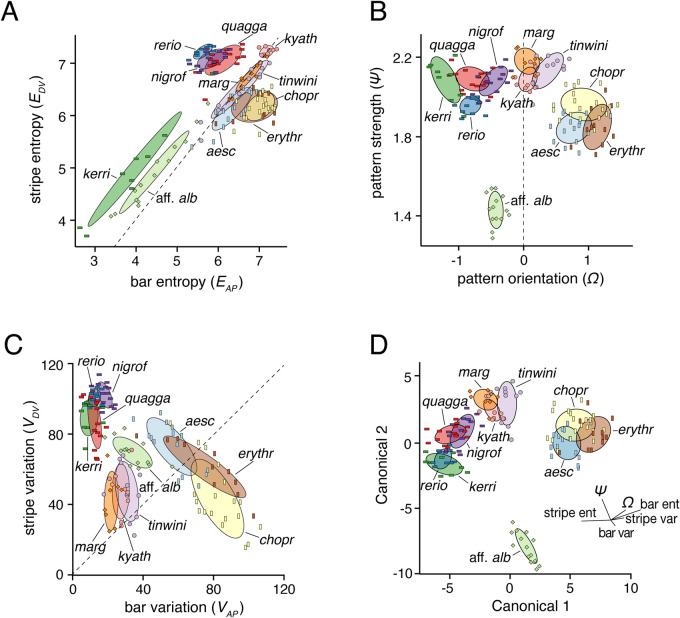
- McCluskey et al., 2021 - Pigment pattern morphospace of Danio fishes: evolutionary diversification and mutational effects
- All Figures
- Figures for McCluskey et al., 2021
|
Fig. 3.