
- Title
-
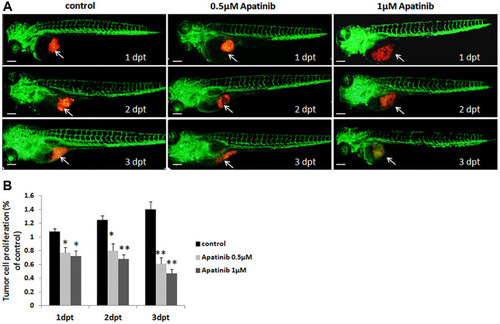
Apatinib inhibits the proliferation of gastric cancer cells via the AKT/GSK signaling pathway in vivo
- Authors
- Chen, Y., Chen, N., Xu, J., Wang, X., Wei, X., Tang, C., Duanmu, Z., Shi, J.
- Source
- Full text @ Aging (Albany NY)

|
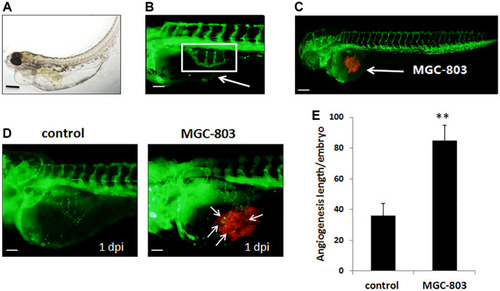
PHENOTYPE:
|

|
|