
- Title
-
Long-Chain Acyl-Carnitines Interfere with Mitochondrial ATP Production Leading to Cardiac Dysfunction in Zebrafish
- Authors
- Park, D.D., Gahr, B.M., Krause, J., Rottbauer, W., Zeller, T., Just, S.
- Source
- Full text @ Int. J. Mol. Sci.
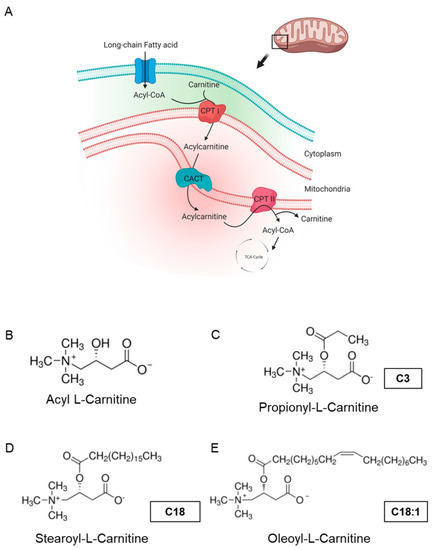
Carnitine shuttle in mitochondria and chemical structures of carnitines. (A) Description of acylcarnitine metabolism (free fatty acid metabolism) in general. Acyl-CoA and carnitine are conjugated (acylcarnitine) by carnitine-palmitoyl transferase I (CPT I) and transported across the inner membrane of mitochondria via carnitine-acylcarnitine translocase (CACT). Then, acyl-CoA and carnitine are released into the mitochondrial matrix by carnitine-palmitoyl transferase 2 (CPT II). Acyl-CoA is finally degraded and released as acetyl-CoA to enter the TCA cycle, synthesizing ATP. Subfigure A is created by BioRender.com (accessed on 23 March, 2021). (B–E) Molecular structures of acyl-l-carnitine, short-chain carnitine and long-chain acylcarnitines (LCACs). |
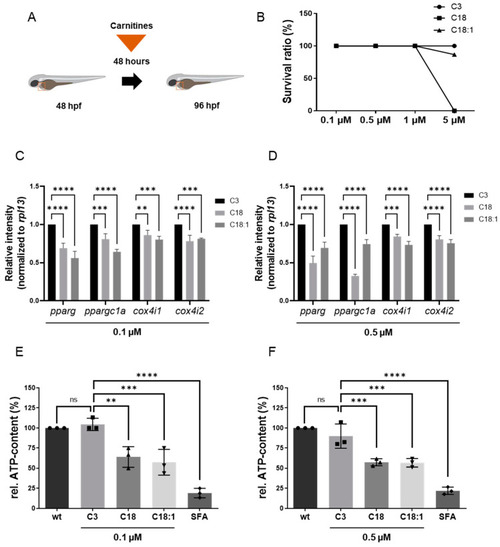
Experimental design of LCAC treatments in zebrafish embryos and survival rates for different concentrations of LCACs. Interrupted mitochondrial function by LCACs is accompanied by decreased ATP production. (A) Experimental design of compound treatments. (B) Lethality of the compounds at different concentrations. (C,D) Quantitative real-time PCR targeting genes related to ATP production (SD, n = 3, ns: p > 0.05, ** p < 0.01, *** p < 0.001, **** p < 0.0001). (E,F) Assessment of relative ATP content in zebrafish embryos after compound treatments (SD, n = 3, ns: p > 0.05, ** p < 0.01, *** p < 0.001, **** p < 0.0001). Abbreviations: rel. = relative, ns = not significant, wt = wild-type, SFA = sodium fluoroacetate. |

LCAC treatment induces cardiac phenotype in embryonic zebrafish. (A–F) Lateral view of embryos after 48 h of incubation with compounds. (A′–F′) Magnified view of hearts from subfigures A–F. |
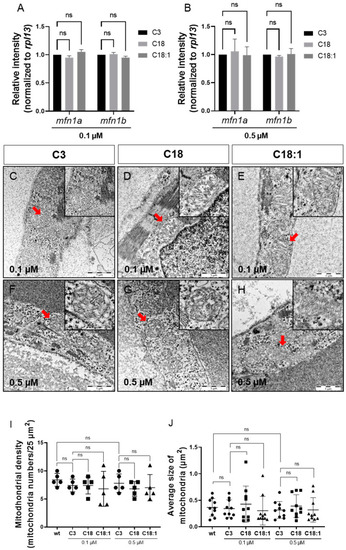
Sustained mitochondrial structure and distribution. (A,B) Quantitative real-time PCR targeting factors responsible for mitochondrial structure (SD, n = 3, ns: p > 0.05). (C–H) Mitochondria of compound-treated embryonic hearts visualized by means of electron microscopy. (I,J) Mitochondrial density and average size of mitochondria in EM images of embryonic zebrafish hearts treated with carnitines (SD, n = 5, 10: respectively, ns: p > 0.05). Abbreviations: ns = not significant, wt = wild-type. |

Cardiac chamber specification and development of LCAC-exposed zebrafish larvae. (A–F) Immunofluorescence staining of carnitine-treated embryonic hearts against sarcomeric myosin heavy chain (MF20) and slow developmental myosin heavy chain (S46). |
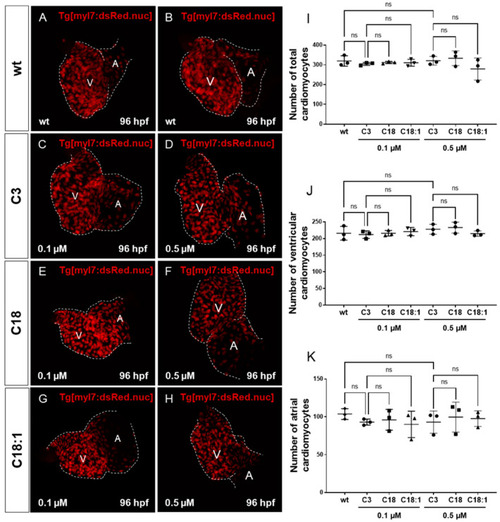
Impact of LCACs on cardiomyocyte numbers in zebrafish embryos. (A–H) Red-fluorescence-positive cardiomyocytes (CMs) of zebrafish embryos in wild-type and 0.1 M or 0.5 µM carnitine-treated embryos. (I–K) Counting CMs of whole heart, ventricle and atrium from wt and C3-, C18- and C18:1-treated embryos (total CMs: wt: 319.33 ± 26.08, C3 0.1 µM: 304.67 ± 7.57, C18 0.1 µM: 311.67 ± 5.51, C18:1 0.1 µM: 310.67 ± 17.56, C3 0.5 µM: 320.67 ± 21.78, C18 0.5 µM: 333.33 ± 37.17, C18:1 0.5 µM: 279.0 ± 55.75, SD, n = 3, ns: p > 0.05; ventricular CMs: wt: 215.67 ± 20.74, C3 0.1 µM: 211.67 ± 11.37, C18 0.1 µM: 215.67 ± 8.33, C18:1 0.1 µM: 220.67 ± 12.34, C3 0.5 µM: 227.67 ± 15.01, C18 0.5 µM: 232.67 ± 16.62, C18:1 0.5 µM: 214.67 ± 8.15, SD, n = 3, ns: p > 0.05; atrial CMs: wt: 103.67 ± 7.02, C3 0.1 µM: 93.0 ± 4.0, C18 0.1 µM: 96.0 ± 13.75, C18:1 0.1 µM: 90.0 ± 17.44, C3 0.5 µM: 93.0 ± 14.73, C18 0.5 µM: 99.67 ± 19.73, C18:1 0.5 µM: 97.67 ± 10.41, SD, n = 3, ns: p > 0.05). Abbreviations: ns = not significant, wt =wild-type. |
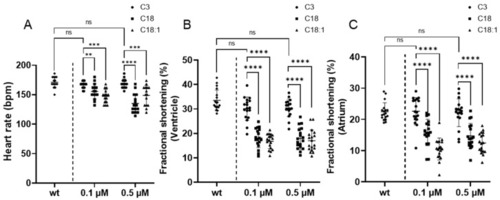
Cardiac dysfunction of zebrafish embryonic hearts resulting from LCAC treatment. (A) Comparison of heart rates between wt and compound-treated larvae. (B,C) Contractility of heart chambers (ventricle and atrium) after compound treatments compared to wt (SD, n = 15, ns: p > 0.05, ** p < 0.01, *** p < 0.001, **** p < 0.0001). Abbreviations: ns = not significant, wt = wild-type. |