
- Title
-
Dead-End (dnd) Gene Cloning and Gonad-Specific Expression Pattern in Starry Flounder (Platichthys stellatus)
- Authors
- Yoon, J.H., Cho, Y.S., Lee, H.B., Park, J.Y., Lim, H.K.
- Source
- Full text @ Animals (Basel)

Nucleotide and amino acid sequence of psdnd. The first methionine amino acid indicates the start codon. Strock indicates the stop codon. Amino acid sequence was analyzed by clustal omega website available at https://www.ebi.ac.uk/Tools/msa/clustalo/ (accessed on 15 March 2020). |

Physical map of cloned psdnd. The psdnd open reading frame (ORF) contains 5 exons and 4 introns. Revealed 73 bp of 5′UTR and 239 bp of 3′UTR. Each exons are shown in different color boxes. Introns expressed thin grey lines. |

Multiple alignments of psdnd with dnd homologues from various vertebrate species. Black text on white: non-similar residues. Blue text on cyan: consensus residue, derived from a block of similar residues at a specific position. Black text on green: consensus residue, derived from an occurrence of ≥50% of a single residue at a specific position. Red on yellow: consensus residue, derived from a completely conserved residue at a specific position. Green text on white: residue similar to consensus residue at a specific position. Red boxes indicate conserved motifs including RRM1, RRM2 and, DSRM. Multiple alignment analyzed by align X program. Conserved domain was analyzed at NCBI conserved domain site. |

Phylogenetic tree and sequences identities comparing psdnd with dnd from various vertebrate species. Phylogenetic tree of psdnd established by MEGAX program with maximum likelihood method. The numbers under the nodes indicate bootstrap percentage values for 1000 replicates. Scale bar indicates number of substitution changes per site. Bootstrap values indicate branch. |
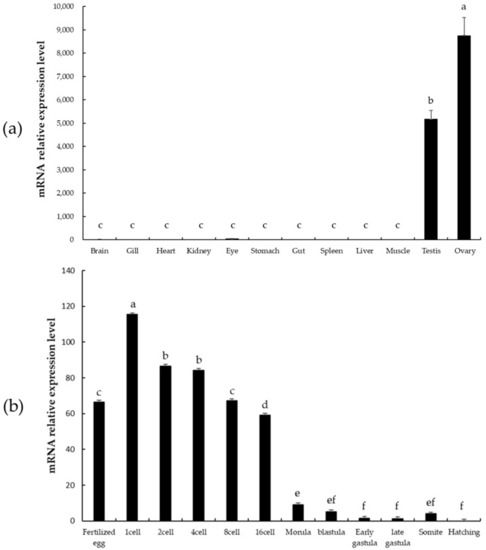
psdnd transcript expression levels in various tissues and embryo stages measured by qRT-PCR. (a) Tissue-specific expression of psdnd (p < 0.05). (b) Embryonic expression of psdnd. Different letters indicate statistically significant difference (p < 0.05). |

psdnd transcript localization during embryogenesis. Embryos were hybridized with antisense psdnd, stained by purple AP. (a) 2 cell stage: psdnd transcripts presented at first cleavage site; (b) 4 cell stage: psdnd positive signals revealed the spots where edges of second cleavage; (c) 32 cell stage; (d) morula stage: four dnd positive signals maintained until morula stage; (e) blastula stage: sister cells developed next to origin cells; (f) early gastrula stage; dnd transcripts increased and clustered at four spots of germ rings; (g) late gastrula stage; psdnd positive signals were move on to body axes; (h) early somite stage; (i) hatching larva: psdnd transcripts were aggregated and move on to future gonad location. Arrows indicate psdnd transcript expression. Scale bar: 100 μm. |