
- Title
-
Comparative Molecular Dynamics Investigation of the Electromotile Hearing Protein Prestin
- Authors
- Abrusci, G., Tarenzi, T., Sturlese, M., Giachin, G., Battistutta, R., Lattanzi, G.
- Source
- Full text @ Int. J. Mol. Sci.
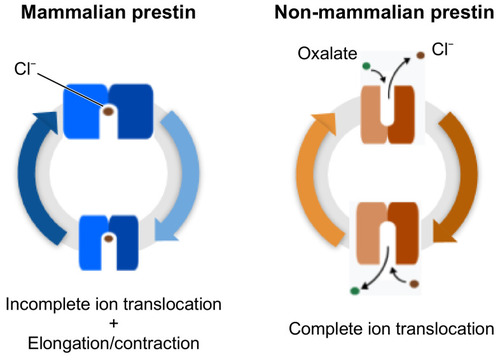
Schematic representations of the electromotile behaviour of prestin in mammals (blue), and of the full substrate transport process in non-mammalian prestin (orange). |
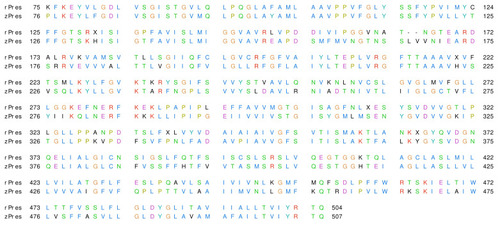
Alignment of rat and zebrafish prestins (rPres and zPres, respectively). The residues are colored according to the ClustalX scheme [54]. |
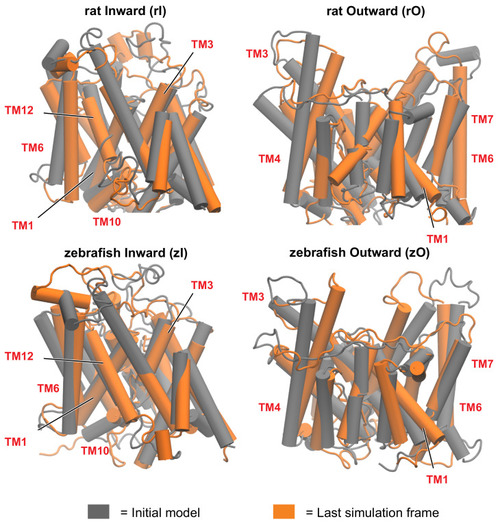
Figure 3 First (grey) and last (orange) frame of the simulation, for rat and zebrafish prestins in the inward-open and outward-open conformations. The rearrangement of the helices is more pronounced in the outward open conformations. Some of the most functionally relevant transmembrane helices (TM), as highlighted in this study, are labelled. |
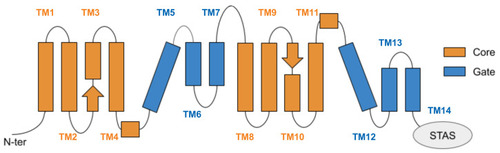
Schematic representation of the transmembrane domain of prestin, located between the N-terminal and the cytoplasmic, anti-sigma factor antagonist (STAS) domain. Helices are arranged according to a 7 transmembrane inverted repeat fold; they are conventionally indicated from 1 to 14, starting from the N-term, and are divided among the gate and core domains. The two arrows represent the short β-strands hosting the putative binding site of chloride ions. |
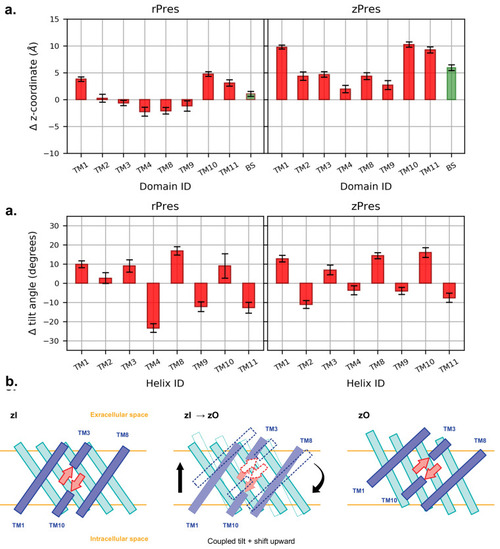
(a) Average shift along the z-axis of the center of mass of each core TM in the outward state (O), with respect to the most representative inward conformation (I), after structural alignment of the gate. BS indicates the β-sheet. A positive value indicate an upward movement of the center of mass when going from I to O. (b) Average difference in the tilt angle of the core TMs, computed comparing each frame of the O simulations and the representative I structures. The tilt angle is taken as the angle between the helix axis and the z-axis. (c) Relative disposition of the core TMs belonging to the inner shell (blue) and outer shell (cyan) and of the β-sheet forming the binding cavity (red), in zI and zO conformations. The latter is the result of a shift and a tilt, which together preserve the secondary structure of the β-sheet and lift it towards the extracellular side. |
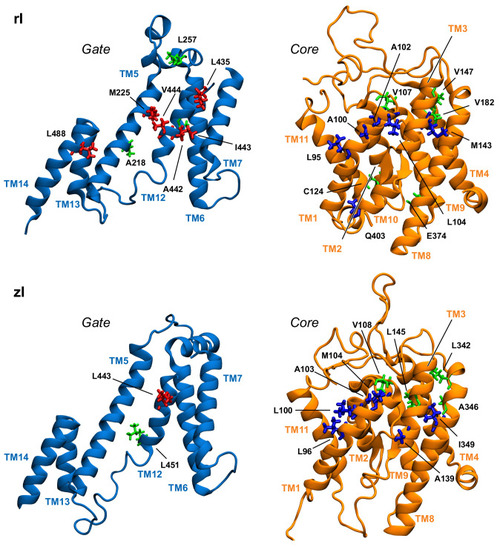
Position in the gate and core domains of the network hubs (in licorice) in the inward-open simulations, as viewed from the interdomain interface. Residues on gate and core that are located at the interface are colored red and blue, respectively. Hub residues not located at the interface are colored green. |
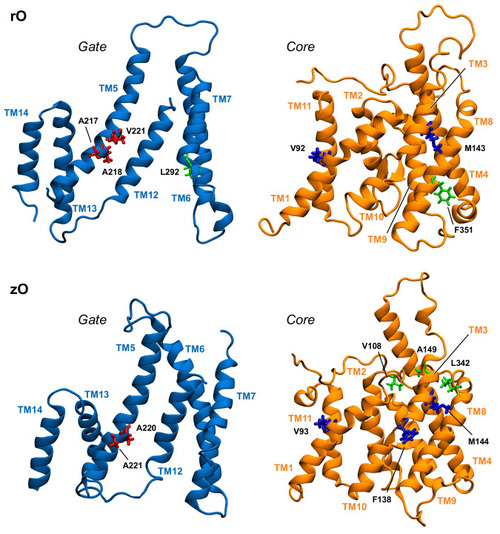
Position in the structure of gate and core domains of the network hubs (in licorice) in the outward-open simulations, as viewed from the interdomain interface. Residues on gate and core that are located at the interface are colored red and blue, respectively. Hub residues not located at the interface are colored green. |
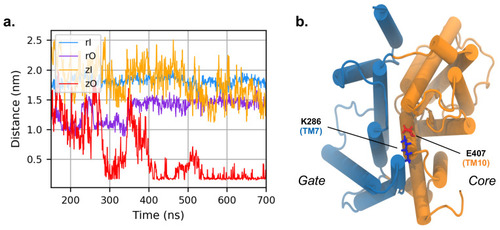
(a) Distance between K286 and E407 during the simulation of zPres and rPres (in the latter case, the corresponding residues are K283 and E404). (b) Cytoplasmic view of the zO; E407 is in red and K286 in blue. The core and gate domains are highlighted in orange and light blue, respectively. |

Binding of chloride ions as occurred during the simulation with applied electric field in rI (a) and zI (b). The highlighted residues are the functional amino acids identified in the work by Walter et al. [9]. |
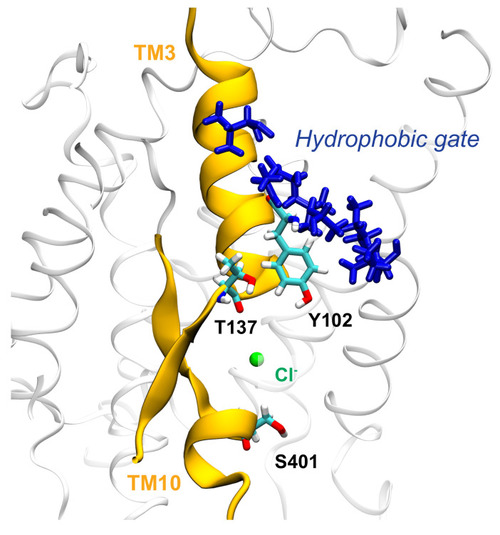
Cl− ion in the binding cavity of zI where it can interact with the hydroxyl groups of Y102 and T137; we suggest that these strong electrostatic interactions can drive the conformational change, by leading to the opening of the hydrophobic cluster (residues A101, A103, L105, V108, I446, I447) located above the binding site. |