
- Title
-
Establishing a high throughput drug screening system for cerebral ischemia using zebrafish larvae
- Authors
- Matsumoto, M., Miyamoto, M., Sawahata, M., Izumi, Y., Takada-Takatori, Y., Kume, T.
- Source
- Full text @ J. Pharmacol. Sci.
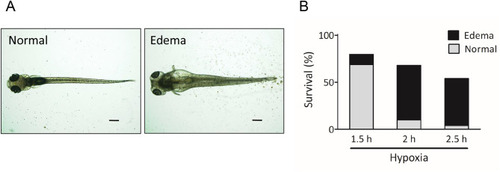
Hypoxia using oxygen absorber induced trunk and head edema and decreased survival rate. (A) After 4 dpf zebrafish larvae were exposed to hypoxia using the oxygen absorber, they were maintained in normoxic E3 medium for 24 h, and subsequently observed. The photographs show representative images of normal and abnormal larvae, depicting edema in the trunk and head. Scale bar = 300 μm. (B) Hypoxic exposure decreased survival rate in a time dependent manner. n = 45–50. PHENOTYPE:
|
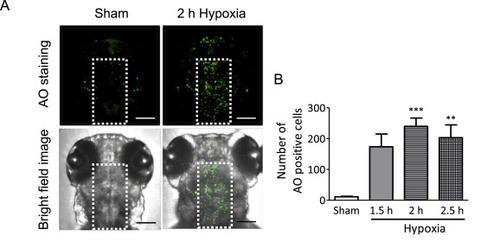
Hypoxia induced cell death in the brain of zebrafish larvae. (A) Following hypoxia, larvae were maintained in normoxic E3 medium for 24 h, and subsequently stained with acridine orange (AO). AO positive cells were counted in white dots area of the brain except near the eyes to detect dead cells in the brain. (B) The effect of hypoxia on cell death in the brain. Scale bar = 100 μm n = 4–25. ∗∗P < 0.01, ∗∗∗P < 0.001 vs sham. PHENOTYPE:
|

Hypoxia induced neuronal cell damage in zebrafish larvae. (A) Following hypoxia, they were maintained in normoxic E3 medium for 24 h. Fluorescence intensity of Kaede was measured before hypoxia and 24 h after normoxic condition. The fluorescence intensity of Kaede was measured in white dots area of the brain. (B) The effect of hypoxia on neuronal cell damage. Fluorescence intensity (% control) = After hypoxia/Control (before hypoxia). Scale bar = 100 μm n = 11–12. ∗∗P < 0.01 vs control. |
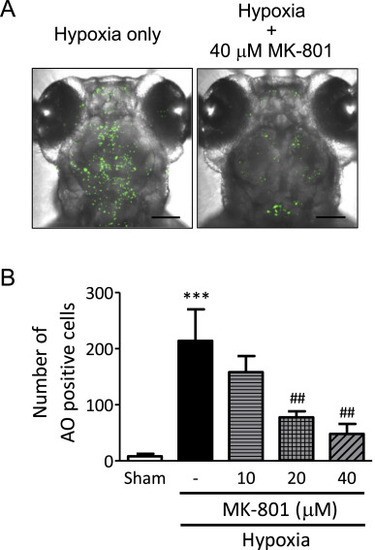
MK-801, an NMDA receptor antagonist, prevented cell death induced by hypoxia. (A) Following hypoxia, larvae were maintained in normoxic E3 medium for 24 h, and subsequently stained with AO. AO positive cells were counted in white dots area of the brain except near the eyes to detect dead cells in the brain. Scale bar = 100 μm. (B) The effect of MK-801 on hypoxia-induced cell death in the brain. n = 4–9. ∗∗∗P < 0.001 vs sham, ##P < 0.01 vs hypoxia only. PHENOTYPE:
|

Edaravone, a free radical scavenger, prevented cell death induced by hypoxia. (A) Following hypoxia, larvae were maintained in normoxic E3 medium for 24 h, and subsequently stained with AO. AO positive cells were counted in white dots area of the brain except near the eyes to detect dead cells in the brain. Scale bar = 100 μm. (B) The effect of edaravone on hypoxia-induced cell death in the brain. n = 5–17. ∗∗∗P < 0.001 vs sham, #P < 0.05 vs hypoxia only. PHENOTYPE:
|