FIGURE SUMMARY
Title

Autophagy Blockade by Ai Du Qing Formula Promotes Chemosensitivity of Breast Cancer Stem Cells Via GRP78/β-Catenin/ABCG2 Axis

Authors
Liao, M., Wang, C., Yang, B., Huang, D., Zheng, Y., Wang, S., Wang, X., Zhang, J., Tang, C., Xu, Z., He, Y., Huang, R., Zhang, F., Wang, Z., Wang, N.
Source
Full text @ Front Pharmacol

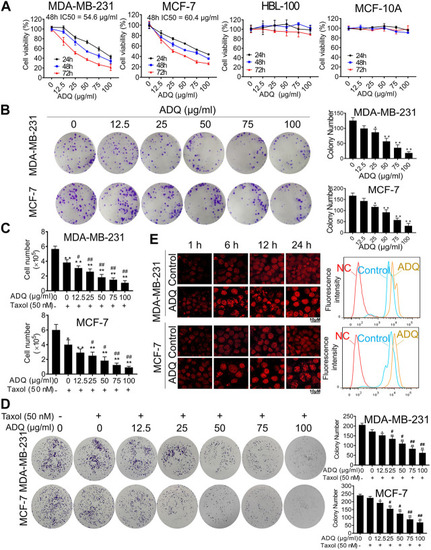
Ai Du Qing formula (ADQ) exerts anti-cancer and chemosensitivity effects on breast cancer cells. (A) CCK8 assay demonstrated that ADQ (0–100 μg/ml) exerted an inhibitory effect on breast cancer cells MDA-MB-231 and MCF-7, while posing little cytotoxicity on non-malignant mammary epithelial cell lines HBL-100 and MCF-10A. (B) ADQ exerted an obvious inhibition on the colony formation abilities of breast cancer cell lines MDA-MB-231 and MCF-7 at different concentrations (0–100 μg/ml). (C) Cell counting assay showed a synergistic effect of ADQ (0–100 μg/ml) with 50 nM taxol in MDA-MB-231 and MCF-7 cells. (D) Drug efflux assay demonstrated that ADQ (50 μg/ml) could increase the intake of epirubicin (10 μg/ml) in MDA-MB-231 and MCF-7 cells based on flow cytometry and laser confocal. (E) Colony formation assay demonstrated synergistic effects of ADQ with taxol to suppress the colony size and number of MDA-MB-231 and MCF-7 cells. All values represent the means ± SD (n = 3, *p < 0.05, **p < 0.01 vs. Control group; #p < 0.05, ##p < 0.01 vs. Taxol group).

ADQ attenuates the proliferation, self-renewal and differentiation of breast CSCs. (A) ADQ administration for 48 h could remarkably reduce the proportions of CD44+CD24−/low subsets in both the MDA-MB-231 cells and MCF-7 cells. (B) 50 μg/ml ADQ with or without 50 nM taxol markedly limited the numbers and sizes of the primary and secondary mammospheres. (C) ADQ treatment dramatically attenuated the differentiation ability of breast CSCs. All values represent the means ± SD (n = 3, *p < 0.05, **p < 0.01 vs. Control group; #p < 0.05, ##p < 0.01 vs. Taxol group).

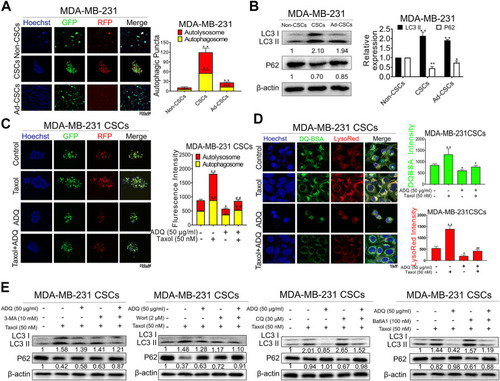
ADQ abrogates autophagy activity in breast CSCs. (A) Representative images of autophagic flux in breast CSC spheres, adherent breast cancer cells as well as differentiated breast CSCs. (B) The LC3 II and P62 expressions were analyzed by western blotting. All values represent the mean ± SD (n = 3, *p < 0.05, **p < 0.01 vs. Non-CSCs group). (C) Representative confocal images of autophagic flux in MDA-MB-231 CSC spheres transfected with the AVV-mRFP-GFP-LC3 reporter after the indicated treatment. All values represent the means ± SD (n = 3, *p < 0.05, **p < 0.01 vs. Control group; #p < 0.05, ##p < 0.01 vs. Taxol group). (D) The fluorescence photographs of MDA-MB-231 CSC spheres were marked by DQ-BSA (green) or LysoRed (red) after the indicated treatment. All values represent the means ± SD (n = 3, *p < 0.05, **p < 0.01 vs. Control group; #p < 0.05, ##p < 0.01 vs. Taxol group). (E) Representative bands of LC3 II and P62 in MDA-MB-231 CSCs with or without early autophagy inhibitor (3-mA, wortmannin) and late autophagy inhibitor (CQ, bafilomycin A1) after the indicated treatment.

ADQ activates the Akt/GSK3β-mediated proteasome degradation of β-catenin in breast CSCs. (A) The expressions of β-catenin, ABCG2, P62 and LC3 in MDA-MB-231 CSCs were examined by western blotting after the indicated treatment. (B) The fractional or total expressions of β-catenin, ABCG2, P62 and LC3 in MDA-MB-231 CSCs were assayed by western blotting after the indicated treatment. (C) Representative immunofluorescent images of β-catenin in MDA-MB-231 CSCs spheres and its re-attached CSC cells. All values represent the means ± SD (n = 3, *p < 0.05, **p < 0.01 vs. Control group; #p < 0.05, ##p < 0.01 vs. Taxol group). (D) The impacts of ADQ on the β-catenin proteasome degradation pathway were evaluated by western blotting. The upper graph shows that the action of ADQ on β-catenin degradation was blocked by the proteasome inhibitor MG132. The lower graph indicates the influence of ADQ on β-catenin degradation was accelerated by the protein synthesis inhibitor CHX. All values represent the means ± SD (n = 3, *p < 0.05, **p < 0.01 vs. Control group; #p < 0.05, ##p < 0.01 vs. Taxol group). (E) Western blotting analysis demonstrated that ADQ administration notably affected the expressions of the phosphorylation of β-catenin, total/phosphorylation of GSK-3β as well as total/phosphorylation of AKT in a time- and dose-dependent manner. (F) Western blotting analysis showing the synergsitic effects of ADQ with either GSK-3β inhibitor LiCl or AKT inhibitor LY294002.

GRP78 decreases breast cancer chemosensitivity possibly via autophagy induction of breast CSCs. (A) Western blotting verified the expressions of GRP78, LC3, P62, β-catenin, ABCG2, GSK-3β, P-GSK-3β, AKT and P-AKT in MDA-MB-231 cells before or after the indicated transfection. (B) CCK8 assay detected the cell proliferation in GRP78high and GRP78low MDA-MB-231 cells with or without taxol administration. All values represent the means ± SD (n = 3, *p < 0.05, **p < 0.01 vs. Vec group; #p < 0.05, ##p < 0.01 vs. shCtrl group). (C) Colony formation assay was performed to evaluate the long-term inhibitory effects of ADQ on GRP78high and GRP78low MDA-MB-231 cells. All values represent the means ± SD (n = 3, *p < 0.05, **p < 0.01 vs. Control group). (D) Sphere-forming assay in MDA-MB-231 CSCs before or after the indicated transfection. All values represent the means ± SD (n = 3, *p < 0.05, **p < 0.01 vs. Control group). (E) Fluorescence photographs of autophagic flux transfected with an LC3-GFP-mRFP reporter in GRP78high and GRP78low MDA-MB-231 cells. All values represent the means ± SD (n = 3, *p < 0.05, **p < 0.01 vs. Vec group; #p < 0.05, ##p < 0.01 vs. shCtrl group).

GRP78 suppression by ADQ leads to a β-catenin destabilization and an autophagy inhibition in breast CSCs. (A) Western blotting analysis showed that ADQ treatment for 48 h could inhibit GRP78 protein expression levels in MDA-MB-231 cells and MCF-7 cells in the presence of taxol. All values represent the means ± SD (n = 3, *p < 0.05, **p < 0.01 vs. Control group; #p < 0.05, ##p < 0.01 vs. Taxol group). (B) Mammospheres assay and immunofluorescence analysis suggested that ADQ administration for 48 h could attenuate self-renewal and autophagic activities in GRP78high MDA-MB-231 CSCs. (C) Western blotting analysis demonstrated that the autophagy activity in GRP78-overexpressed breast CSCs was significantly limited by the combination of 3-MA and ADQ. (D) Immunofluorescence experiments showed that ADQ not only limited the transfer of β-catenin from the cytoplasm to the nucleus, but also decreased the expression of β-catenin in GRP78high MDA-MB-231 CSCs. (E) ADQ treatment for 48 h could attenuate β-catenin and ABCG2 expressions in GRP78high MDA-MB-231 CSCs. (F)–(G) Cell number and sphere formation assay using GRP78high MDA-MB-231 CSCs transfected with or without siβ-catenin after the indicated treatment. All values represent the means ± SD (n = 3, *p < 0.05, **p < 0.01 vs. Control group; #p < 0.05, ##p < 0.01 vs. Taxol group). (H) Western blotting assay showing the effects of ADQ on the β-catenin proteasome degradation pathway in GRP78high MDA-MB-231 CSCs. (I) Co-immunoprecipitation and ubiquitination array revealed that GRP78 overexpression reduced poly-ubiquitination accumulation of β-catenin in breast CSCs, while ADQ administration notably promoted the ubiquitination of β-catenin in breast CSCs.

ADQ enhances the chemosensitivity of breast cancer in ex vivo and in vivo validation. (A) Representative bioluminescent images of MDA-MB-231-Luc xenograft mice model. Breast cancer xenografts were established by implanting luciferase-labeled MDA-MB-231-Luc cells into the mammary glands of BALB/C mice. Mice bearing MDA-MB-231-Luc xenografts received either saline or ADQ (100 mg/kg/day) by intragastric perfusion. All values represent the means ± SD (n = 4, *p < 0.05, **p < 0.01 vs. Control group; #p < 0.05, ##p < 0.01 vs. Taxol group). (B,C) ADQ synergistically interacted with taxol to inhibit tumor growth in the MDA-MB-241-Luc xenograft model in vivo. All values represent the means ± SD (n = 4, *p < 0.05, **p < 0.01 vs. Control group; #p < 0.05, ##p < 0.01 vs. Taxol group). (D) There were no significant differences in mouse body weights between the saline group and ADQ group, indicating no additional toxic and side effects of ADQ. n = 8. (E) ADQ administration obviously diminished the proportions of ALDH+ subsets induced by taxol. All values represent the means ± SD (n = 4, *p < 0.05, **p < 0.01 vs. Control group; #p < 0.05, ##p < 0.01 vs. Taxol group). (F) ADQ (50 μg/ml) remarkably enhanced the inhibitory effects of Taxol (50 nM) on the zebrafish models bearing Dil-labled MDA-MB-231 cells. The red numbers represent the mean fluorescence intensities of Dil-stained MDA-MB-231 cells. All values represent the means ± SD (n = 4, *p < 0.05, **p < 0.01 vs. Control group; #p < 0.05, ##p < 0.01 vs. Taxol group). (G) Representative images of H&E and representative IHC images of the expression levels of GRP78, β-catenin, and LC3 in zebrafish models.

Acknowledgments
This image is the copyrighted work of the attributed author or publisher, and ZFIN has permission only to display this image to its users. Additional permissions should be obtained from the applicable author or publisher of the image. Full text @ Front Pharmacol