
- Title
-
Chimeric Claudins: A New Tool to Study Tight Junction Structure and Function
- Authors
- Taylor, A., Warner, M., Mendoza, C., Memmott, C., LeCheminant, T., Bailey, S., Christensen, C., Keller, J., Suli, A., Mizrachi, D.
- Source
- Full text @ Int. J. Mol. Sci.

Synthetic design and characterization of MBP-CC1. (A) Amino acid composition of CC1. Light blue is soluble protein 2jua and in red is hCLDN1. All chimeric constructs have MBP as N-terminal fusion and a 6xHis tag at the C-terminus. Additionally, we present the full amino acid sequence of the translated CC1. (B) Graphical representation of the chimeric design to produce CC1. (C) Graphical representation of the chimeric design to produce MBP-CC1. The dimensions of relevant axis of MBP-CC1 are presented. MBP, in light blue, also displays, in dark blue, the position and structure of the short linker of four amino acids (Asn, Ala, Ala, Ala). (D) Size-exclusion chromatography of MBP-CC1. The monomeric MBP-CC1 has a molecular weight of 65 kDa. When comparing its elution volume with the protein standards (BioRad Gel Filtration Standard, cat. Number 1511901), MBP-CC1 appears to elute above 670 kDa. Below the x-axis, Vo is void volume, and the numbers correspond to standards of molecular weight. (E) Small-angle X-ray scattering (bioSAXS) of MBP-CC1 performed at 21 °C. Two different orientations of the volumetric data are presented. bioSAXS data collected for MBP-CC1resulted in a radius of gyration (Rg) of 83.1 ± 4.03, and a maximum particle size (Dmax) of 305 Å. |
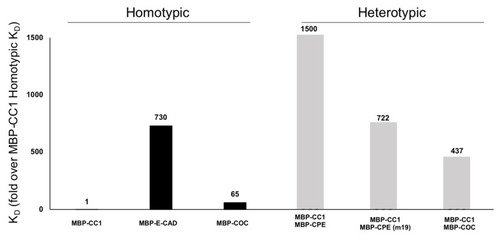
Surface Plasmon Resonance (SPR) of MBP-CC1. The constant of affinity (KD) of several proteins associated with the TJ were determined by SPR. Using MBP-CC1 homotypic interaction as a control, we normalized the KD of the other interactions. Homotypic interactions of MBP-CC1, MBP-eCAD (AJ), and MBP-COC. These results suggest that CLDN1 interactions are 700-times stronger than MBP-eCAD or 65-times stronger than MBP-COC. We followed this analysis with heterotypic interactions of MBP-CC1 with MBP-CPE and MBP-CPE(m19) mutant or the interactions between MBP-CC1 and MBP-COC. |

MBP-CC1 in vitro experiments. (A) Caco-2 cells were treated with MBP-CC1, MBP-CC2, MBP-CC3 or MBP-COC. No addition of proteins or MBP-CPE was used for controls. The graph represents the change in TEER compared to the control (no addition of protein). Following treatment, TEER was monitored for 24 h (intervals of 0, 1, 2, 4, 8, 12, and 24 h). Three experiments are averaged in the graph (±SD). (B) Cal27 cells were treated with EGF, MBP-CC1, MBP-COC, MBP-CPE or MBP-CPE(m19). After 24 h of treatment, cells were prepared for the proliferation assay (ATPlite, Perkin Elmer). Proliferation is reported as the average of 4 separate experiments (±SD). For statistical analysis, we employed t-test, and the asterisk represents a statistical significance (p < 0.001). |

MBP-zfCC11A, in vivo. MBP-zfCC11A was the reagent selected to validate the use of chimeric CLDNs to observe its effects in vivo. Zebrafish embryos treated at 12 hpf, imaged at 21 hpf. Images taken with 20× lens at 3× zoom. Panel (A), Zebrafish embryos. NT, no treatment; RT, embryos maintained at room temperature; C50, 50 μg of MBP-2jua as control; Z10, Z25, Z50, 10, 25 or 50 μg/mL of MBP-zfCC11A. Panel (B), qualitative analysis of somite development. NT, no treatment; RT, embryos maintained at room temperature; C50, 50 μg of 2jua as control; Z50, 50 μg of zfCC11A. |