
- Title
-
The pattern of Nodal morphogen signaling is shaped by co-receptor expression
- Authors
- Lord, N.D., Carte, A.N., Abitua, P.B., Schier, A.F.
- Source
- Full text @ Elife

(A) Schematic of sensor cell assay. Mvg1 donor embryos were marked by injecting gfp mRNA at the 1-cell stage. At high stage, just before the onset of Nodal signaling, GFP-marked sensor cells were transplanted from the animal pole of the donor to the margin of a Nodal-insensitive host. At 50% epiboly, embryos were fixed and immunostained for GFP and Nodal signaling activity (α-pSmad2). Imaging of chimeric embryos (far right) enables inference of the gradient shape from α-pSmad2 staining (magenta) in sensor cells (green). Because host embryos lack the ability to respond to Nodal, YSL-derived Nodal ligands are responsible for the shape of the Nodal signaling gradient. (B) Control visualization of the Nodal signaling gradient in wild-type hosts using a sensor cell assay. Upper panel; Mvg1 sensor cells (yellow) were transplanted to the margin of a wild-type host. Nodal signaling was visualized by α-pSmad2 staining (magenta), and sensor cell boundaries were segmented with an automated pipeline (white curves). YSL boundaries are marked with dashed white curves. Lower panel; quantification of staining intensity in host (blue) and sensor (red) cells across replicate embryos. Nuclei were segmented from DAPI signal using an automated analysis pipeline implemented in MATLAB. Sensor and host cells were identified as being clearly GFP positive or negative, respectively. Solid curves represent sliding window averages. Plot was derived from three replicate embryos. (C) Sensor cell assay in MZsmad2 host embryos. Upper panel; GFP-marked Mvg1 sensor cells (yellow) were transplanted to the margin of MZsmad2 host embryos. Nodal signaling was visualized with α-pSmad2 staining (magenta). Sensor cell boundaries are marked with white outlines, and YSL boundaries are marked with dashed white curves. Lower panel; quantification of host (blue) and sensor (red) cell staining intensities were carried out as in (B). Plot was derived from six replicate embryos. |

This experiment summarizes control experiments that verify that our α-pSmad2 staining protocol detects Nodal signaling activity in wild-type embryos but not MZsmad2, MZoep, or Mvg1 mutants. Pixel intensities are directly comparable between all α-pSmad2 channel images. (A) Flat-mount image of wild-type 50% epiboly embryo stained with DAPI and α-pSmad2 antibody. Images are maximum intensity projections from a representative embryo. (B) Flat-mount image of MZsmad2 50% epiboly embryo stained with DAPI and α-pSmad2 antibody. Images are maximum intensity projections from a representative embryo. (C) Flat-mount image of MZoep 50% epiboly embryo stained with DAPI and α-pSmad2 antibody. Images are maximum intensity projections from a representative embryo. (D) Flat-mount image of Mvg1 50% epiboly embryo stained with DAPI and α-pSmad2 antibody. Images are maximum intensity projections from a representative embryo. |

To verify that MZsmad2 and MZoep embryos express Nodals in the YSL, we stained for cyclops and squint mRNA by smFISH. All depicted embryos were counterstained with DAPI to mark nuclei and α-eCdh1 to mark cell boundaries (A) Wild-type embryos express squint mRNA in the YSL and blastoderm at 50% epiboly. (A’) Enlarged view of area within the white box from panel (A). (B) MZsmad2 embryos express squint mRNA in the YSL, but not the blastoderm, at 50% epiboly. (B’) Enlarged view of area within the white box from panel (B). (C) MZoep embryos express squint mRNA in the YSL, but not the blastoderm, at 50% epiboly. (C’) Enlarged view of area within the white box from panel (C). (D) Wild-type embryos express cyclops mRNA in the YSL and blastoderm at 50% epiboly. (D’) Enlarged view of area within the white box from panel (D). (E) MZsmad2 embryos express cyclops mRNA in the YSL, but not the blastoderm, at 50% epiboly. (E’) Enlarged view of area within the white box from panel (E). (F) MZoep embryos express cyclops mRNA in the YSL, but not the blastoderm, at 50% epiboly. (F’) Enlarged view of area within the white box from panel (F). |
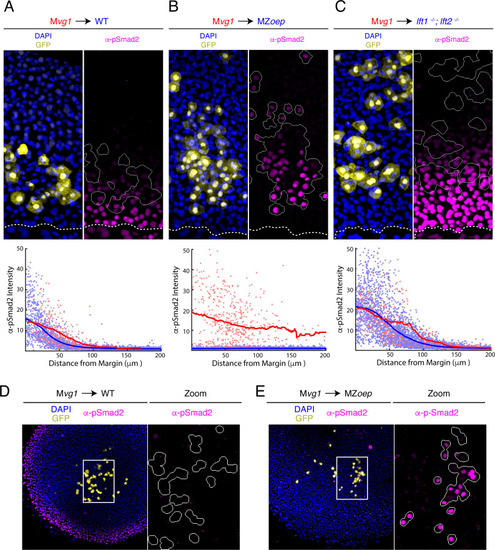
(A-C) Sensor cell assay and gradient quantifications in (A) wild type, (B) MZoep, and (C) lft1-/-;lft2-/- embryos. Mvg1 sensor cells were marked with GFP (yellow) and transplanted to the margin of host embryos. Nodal signaling activity is measured by α-pSmad2 immunostaining (magenta). YSL boundaries are marked with dashed curves and sensor cell boundaries are outlined in solid white in all α-pSmad2 panels. Gradient quantifications for each experiment are below images; host and sensor cell staining intensities are plotted as blue and red points, respectively. Sliding window averages are plotted as solid curves. Plots for wild type, MZoep, and lft1-/-;lft2-/- backgrounds were derived from 8, 10, and 8 replicate embryos, respectively. Decay parameters for single-exponential model fits (±95% confidence bounds) are −0.02 ± 0.004 μm−1,–0.007 ± 0.002 μm−1 and −0.013 ± 0.002 μm−1 for wild-type, MZoep and lft1-/-;lft2-/ hosts, respectively. (D) Left panel; Mvg1 sensor cells (yellow) were transplanted directly to the animal pole of a wild-type host. The endogenous Nodal signaling gradient is visible at the embryonic margin (magenta). White box highlights region expanded for detail view in right panel. Right panel; Nodal signaling activity is absent in both host and sensor cells. (E) Left panel; Mvg1 sensor cells (yellow) were transplanted to the animal pole of an MZoep embryo. Nodal signaling is absent at the embryonic margin. White box highlights region expanded in the right panel. Right; sensor cells detect Nodal at the animal pole (magenta). |

To test whether Cyclops and Squint spread over a long range in the absence of Oep, we generated MZ |

Our transplantation procedure leads to random variation in the number and position of sensor cells in host embryos. We therefore investigated whether clustering (i.e. variation in the number of nearby sensor cells) affects the behavior of each sensor. The data presented in this figure derive from the Mvg1 to MZoep sensor cell experiment of main text Figure 2B. (A) Definition of neighboring cells. For each sensor cell (center of dashed circle), sensor cells within a 30 μm radius (area within dashed circle) are counted as neighbors. (B) Illustration of pSmad2 staining residual using main text Figure 2B. We define the pSmad2 staining residual for each sensor as the difference between its observed staining intensity and the expected intensity given its distance from the Nodal source. In this illustration, the residual for the highlighted sensor cell (large red point) is the vertical distance (arrow) to the sliding window average of all sensor cells (red curve). Host cell staining intensities are depicted as blue points. (C) Neighbor number does not influence pSmad2 staining residual. Scatter plot of the number of sensor cells within a 30 μm radius against pSmad2 staining residual. Each point represents a sensor cell, and the figure pools sensors from 10 host embryos. The least-squares linear fit is plotted (red line, R2 = 0.003). If Nodal sensitivity increased or decreased with the number of nearby sensors, the plot would show an increasing or decreasing trend, respectively. (D) Sensor behavior is independent of total number of transplanted cells. The total number sensors transplanted into each MZoep host embryo is scattered against the average pSmad2 staining residual for all sensors in that embryo. The least-squares linear fit is plotted (red line, R2 = 0.009). If Nodal sensitivity increased or decreased with the total number of transplanted cells, the plot would show a clear positive or negative trend, respectively. |

( |
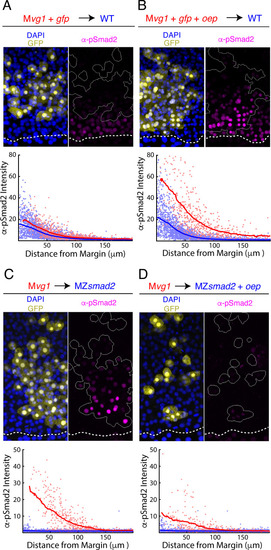
(A–B) Oep overexpression increases sensitivity to Nodal ligands. (A) Upper panel: control transplant of GFP-marked Mvg1 sensor cells (yellow) to the margin of wild-type hosts. Nodal signaling activity was measured by α-pSmad2 immunostaining (magenta). In all panels, YSL boundaries are marked with dashed white curves, and sensor cells have been outlined in solid white in all α-pSmad2 panels. Lower panel: quantification of Nodal signaling in sensor (red) and host cells (blue) across replicate embryos. Sliding window averages are plotted as solid curves. Plot was derived from eight replicate embryos. (B) Upper panel: transplant of sensor cells from an Mvg1 donor injected with gfp and 110 pg oep mRNA at the one-cell stage to the margin of wild-type hosts. Sensor cells (yellow) exhibit enhanced Nodal signaling activity (magenta) compared to their host-derived neighbors. Lower panel; staining of host (blue) and sensor (red) cells was quantified as in (A). Plot was derived from nine replicate embryos. (C-D) Oep overexpression restricts Nodal spread. (C) Upper panel: sensor cell measurement of the Nodal gradient in MZsmad2 embryos. Mvg1 sensor cells were marked with GFP (yellow), and Nodal signaling activity was measured by α-pSmad2 immunostaining (magenta). Lower panel: quantification of Nodal signaling in sensor (red) and host cells (blue) was quantified as in (A). Plot was derived from nine replicate embryos. (D) Upper panel: Mvg1 sensor cell measurement of the Nodal signaling gradient in MZsmad2 hosts injected with 110 pg oep mRNA at the one-cell stage. Lower panel; gradients were quantified as in (A). Plot was derived from nine replicate embryos. |

(A) Direct visualization of long-range spread of Nodal ligand was carried out using a modified sensor cell assay in host embryos producing Vg1-HaloTag and Squint in the YSL. Sensor cells from a wild-type donor embryo injected with 110 pg oep mRNA were transplanted to the animal pole of host embryos injected with vg1-halotag and squint mRNAs in the YSL. Sensor cells producing extra Oep were used to enhance the sensitivity of the assay, akin to previous morphotrap studies (Stapornwongkul et al., 2020; Almuedo-Castillo et al., 2018; Harmansa et al., 2017; Harmansa et al., 2015). The experiment compared wild-type hosts (left), MZoep hosts (middle), or MZoep hosts injected with 110 pg oep mRNA at the one-cell stage (right). HALO-tagged ligands were labeled by staining with Janelia Fluor 646 Halo ligand. Sensor cells were transplanted to the animal pole of labeled host embryos after 1 hr of staining (approximately sphere stage). Loss of oep results in increased accumulation of tagged ligand at the animal pole. (B) Quantification of ligand accumulation in sensor cells. Sensors were manually segmented and average Janelia Fluor 646 channel pixel intensities were calculated. Each point represents a single sensor cell. Violin plots depict the median (white circle) and 25–75 percentile ranges (grey line). Asterisks denote statistical significance of median comparisons between indicated samples (Wilcoxon rank-sum test). |

( |

(A) Schematic of model incorporating production and consumption of receptors. Simulations presented here were performed on a one-dimensional tissue with length 300 μm. Oep replacement is assumed to be constant with rate k3, and Oep removal reflects a combination of constitutive and ligand-dependent endocytosis. In panels A and B, simulations are presented as kymographs; each image column shows the state of the system with the source at the bottom and animal pole at the top. Time proceeds from left to right. (B) Simulation of a wild-type gradient. With continual receptor replacement, the system achieves an exponential steady state gradient with length scale set by the ligand diffusion rate and receptor abundance. The free ligand, free receptor, and receptor-ligand complex concentrations are plotted from left to right in red, cyan, and magenta, respectively. (C) Simulation of gradient formation in a zygotic oep mutant. Simulation details are identical to (B), but with receptor replacement rate (k3) set to zero. The system fails to establish a steady state due to gradual consumption and degradation of receptors. Over time, the Nodal ligand gradient expands (red) to drive a propagating wave of signaling activity (i.e. receptor occupancy, magenta). (D) Time course of Nodal signaling activity in wild-type embryos. Representative α-pSmad2 (magenta) and DAPI (cyan) are shown for dome, 50% epiboly and shield stages (left, middle and right panels, respectively). Compilation of signaling gradients across replicates (far right) shows the establishment of the signaling gradient. Composite gradients were derived from 5, 6, and 6 replicate embryos for dome, 50% epiboly and shield stages, respectively. (E) Time course of Nodal signaling activity in zygotic oep mutants. Over time, the signaling pattern evolves from a gradient (dome stage) to a band displaced far from the margin (shield) as the wave travels outward. Compilation of signaling gradients across replicates (far right) illustrates the outward propagation of signaling. Composite gradients were derived from 7, 6, and 3 replicate embryos for dome, 50% epiboly, and shield stages, respectively. (F) Time course of Nodal signaling activity in zygotic oep mutants presented with pixel scaling equal to that used in (D). In accord with simulations, the wave of signaling propagates with a lower intensity than signaling at the margin of wild-type embryos. |

( |