
- Title
-
Development of a Liquid Chromatography/Mass Spectrometry-Based Inhibition Assay for the Screening of Steroid 5-α Reductase in Human and Fish Cell Lines
- Authors
- Kim, D., Cho, H., Eggers, R., Kim, S.K., Ryu, C.S., Kim, Y.J.
- Source
- Full text @ Molecules
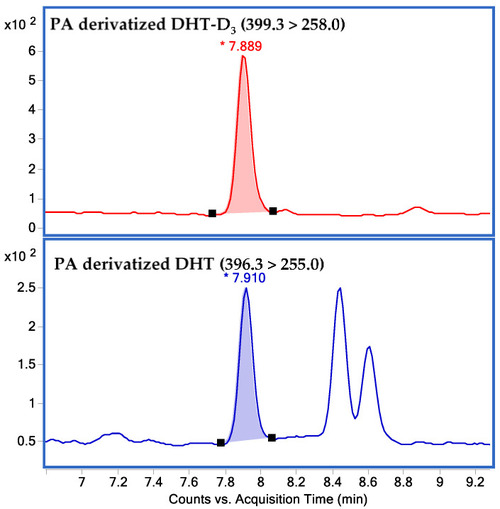
Chromatograms of 2-picolinic acid (PA)-derivatized 5-α dihydrotestosterone (DHT) and DHT-D3. |
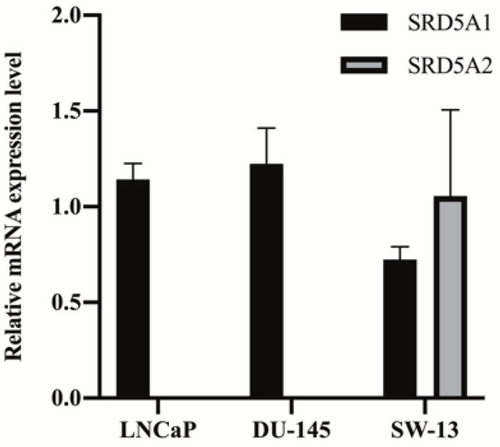
Quantitative PCR analysis for measuring the mRNA expression levels of SRD5A1 and SRD5A2 in the LNCaP, DU-145, and SW-13 cell lines. The data are expressed as the mean ± standard deviation (SD) of three repeated experiments. |
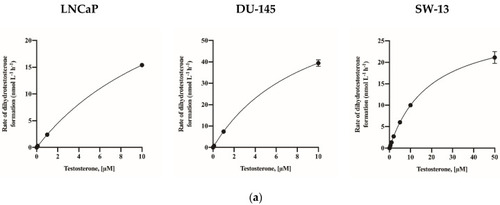
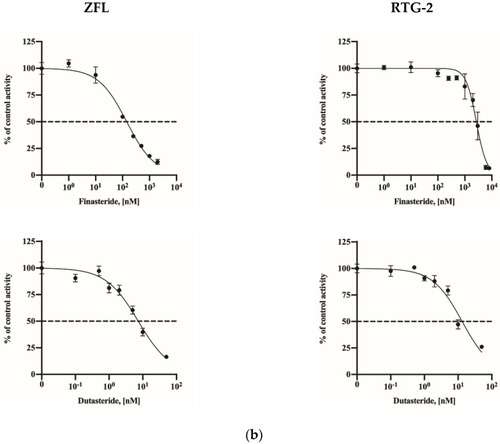
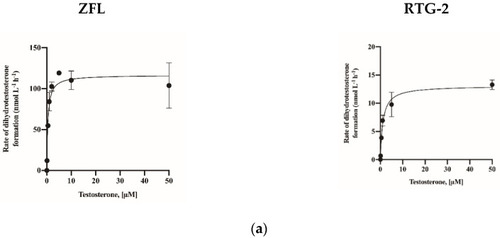
Activity of 5α-reductase (a) and inhibitory effects of finasteride and dutasteride (b) on LNCaP, DU-145, and SW-13 cells. The data are expressed as the mean ± standard deviation (SD) of three repeated experiments. |
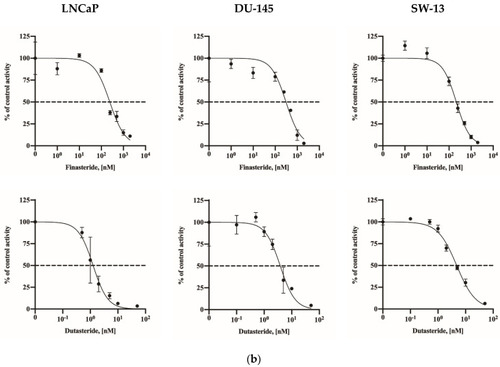
Activity of 5α-reductase (a) and inhibitory effects of finasteride and dutasteride (b) on LNCaP, DU-145, and SW-13 cells. The data are expressed as the mean ± standard deviation (SD) of three repeated experiments. |
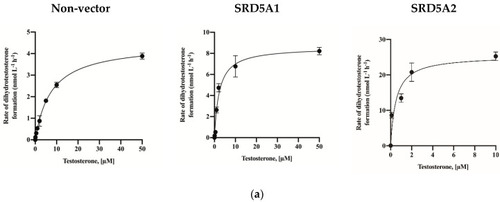
Activity of 5α-reductase (a) and inhibitory effects of finasteride and dutasteride (b) on transfected HEK-293 cells. The data are expressed as the mean ± standard deviation (SD) of three repeated experiments. |
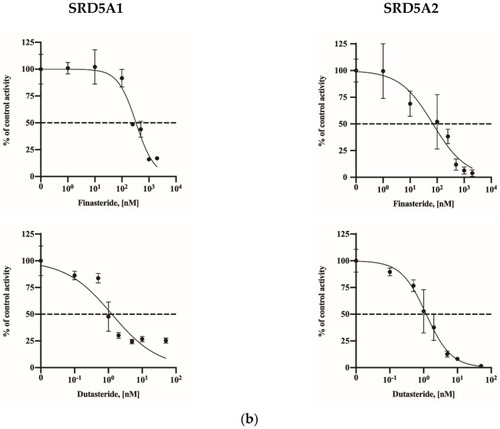
Activity of 5α-reductase (a) and inhibitory effects of finasteride and dutasteride (b) on transfected HEK-293 cells. The data are expressed as the mean ± standard deviation (SD) of three repeated experiments. |
Activity of 5α-reductase ( |
Activity of 5α-reductase ( |