
Image
|
Figure Caption
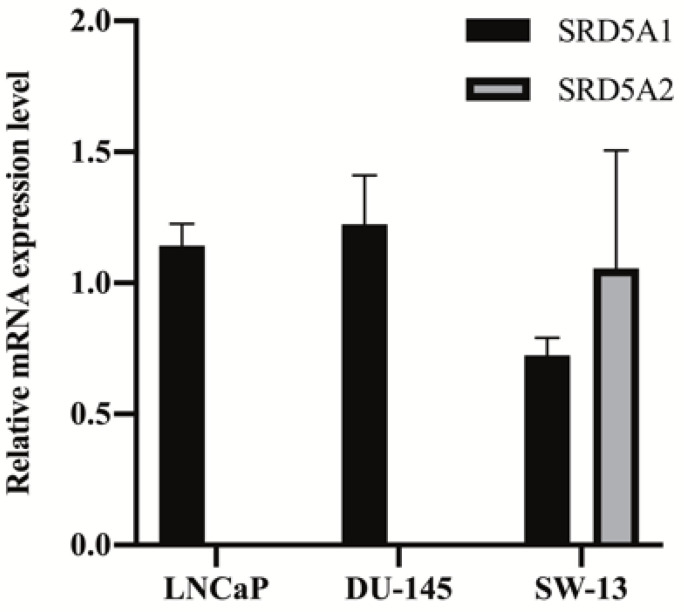
Figure 2 Quantitative PCR analysis for measuring the mRNA expression levels of SRD5A1 and SRD5A2 in the LNCaP, DU-145, and SW-13 cell lines. The data are expressed as the mean ± standard deviation (SD) of three repeated experiments.
Acknowledgments
This image is the copyrighted work of the attributed author or publisher, and
ZFIN has permission only to display this image to its users.
Additional permissions should be obtained from the applicable author or publisher of the image.
Full text @ Molecules