
- Title
-
Therapeutic Nuclear Magnetic Resonance affects the core clock mechanism and associated Hypoxia-inducible factor-1
- Authors
- Thöni, V., Oliva, R., Mauracher, D., Egg, M.
- Source
- Full text @ Chronobiol. Int.
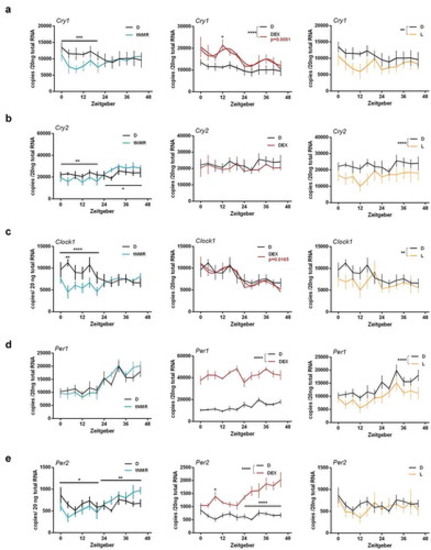
Effects of tNMR, dexamethasone, and light treatment on the cell autonomous clocks of the mouse fibroblast cells NIH3-T3: mRNA expression over two circadian cycles of (A) Cryptochrome1 (Cry 1), (B) Cryptochrome2 (Cry 2), (C) Clock1, (D) Period1 (Per1), and (E) Period2 (Per2); tNMR (left) presented in light blue, dexamethasone DEX (middle) in red, and light irradiation (right) in light orange; presented are means ± SEM, n = 6; asterisks mark significant changes calculated using two-way ANOVA (GraphPad Prism version 6.00). Cosinor analysis was applied using GraphPad Prism version 6.00, as outlined in detail in Oliva et al. (2018). Circadian oscillations of DEX treated cells are indicated by an additional red cosinor wave |
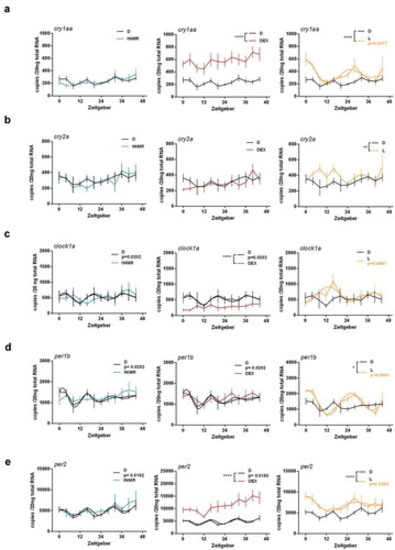
Effects of tNMR, dexamethasone and light on the cell autonomous clocks of zebrafish fibroblast cells Z3: mRNA expression over two circadian cycles of (A) cry1aa, (B) cry2a, (C) clock1a, (D) per1b, and (E) per2; tNMR (left) presented in light blue, dexamethasone DEX (middle) in red, and light irradiation (right) in light orange; presented are means ± SEM, n = 6; asterisks mark significant changes calculated using two-way ANOVA (GraphPad Prism version 6.00). Cosinor analysis was applied using GraphPad Prism version 6.00, as outlined in detail in Oliva et al. (2018). Circadian oscillations of light treated cells are indicated by an additional light orange cosine wave. Circadian oscillations of unsynchronized zebrafish cells kept under constant darkness (in black) show two acrophases per circadian cycle, as previously reported in Oliva et al. (2018) |
Dose effect relationships of tNMR in the cell autonomous clocks of mouse fibroblast cells NIH3-T3: mRNA expression over two circadian cycles of (A) Cry1, (B) Cry2, (C) Per1, (D) Per2, (E) Clock1, and (F) Hif-1α; sham treated cells under constant darkness are shown in black, cells treated with tNMR for 6 h in gray, and cells treated with tNMR for 12 h in white; presented are means ± SEM, n = 4–8. Asterisks mark significant changes calculated using two-way ANOVA (GraphPad Prism version 6.00) |
Dose effect relationships of tNMR in the cell autonomous clocks of zebrafish fibroblast cells Z3: mRNA expression over two circadian cycles of (A) cry1aa, (B) cry2a, (C) per1b, (D) per2, and (E) clock1a; sham treated cells under constant darkness are shown in black, cells treated with tNMR for 6 h in gray, and cells treated with tNMR for 12 h in white; presented are means ± SEM, n = 3–8. Asterisks mark significant changes calculated using two-way ANOVA (GraphPad Prism version 6.00) |
Dose effect relationships between tNMR and proteins levels of clock proteins and HIF-1α in mouse fibroblast NIH3-T3 cells: protein levels over two circadian cycles, semi-quantified using Western Blots, of CLOCK1 (A), CRY1 (B), CRY2 (C), and HIF-1α (D); presented are means ± SEM, n = 5–8. Asterisks mark significant changes calculated using two-way ANOVA (GraphPad Prism version 6.00). Representative blots and ß-actin loading controls are shown below the respective graphs |
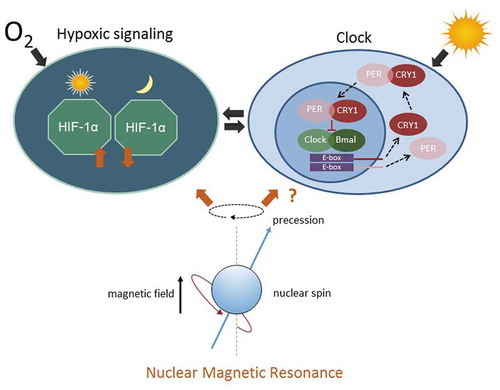
tNMR affects the cell autonomous clocks and hypoxic signaling in mammalian cells: Hypoxic signaling and the circadian clock are bi-directionally intertwined (Adamovich et al. 2016; Egg et al. 2013, 2014; Manella et al. 2020; Peek et al. 2016; Sandbichler et al. 2018; Wu et al. 2016). The hypoxic response is clock controlled and depends on the time of day (left). The circadian clock, in turn, is modulated by HIF-1α according to the available oxygen (right). The interaction between both cell circuits is indicated by the two arrows in the middle. tNMR affects both pathways, leading to up or down regulation of the respective genes and proteins, depending on the dose of irradiation. In unsynchronized mouse fibroblasts, tNMR does not induce expression of rhythmicity |