|
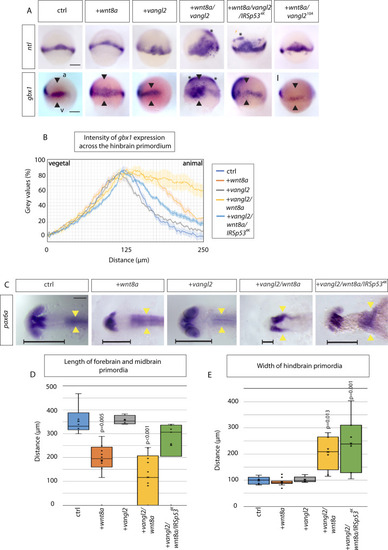
Vangl2 function is crucial for anteroposterior patterning of the zebrafish neural plate.A In situ hybridization analysis of indicated markers in 60% epiboly zebrafish embryos (6.5 hpf) injected with Wnt8a, Vangl2 and Wnt8a/Vangl2, wnt8a/vangl2/IRSp534K, wnt8a/vangl210A. Scale bar indicates 200μm. (ntl: n = 35, 16, 6, 12, 13, 19 embryos) (gbx1: n = 6, 19, 3, 11, 22, 19 embryos). a = animal pole, v = vegetal pole. Black arrowheads indicate width of gbx1 expression. Asterisks indicate ectopic expression. B Intensity of gbx1 expression from in situ hybridization (gray values in %) across the hindbrain primordium from vegetal (v) to animal (a) pole in embryos injected with indicated constructs at 60% epiboly (6.5 hpf): Control- light blue, wnt8- orange, vangl2 - gray, wnt8a/vangl2- yellow, wnt8a/vangl2/IRSp534K- dark blue. C In situ hybridization to mark pax6a expression in the primordia of the forebrain and the hindbrain in embryos injected with mRNAs for the indicated constructs at 24 hpf: control, wnt8a, vangl2, wnt8a/vangl2, and wnt8a/vangl2/IRSp534K. Scale bar indicates 100 μm. Horizontal black line indicates length of forebrain and midbrain primordium. Yellow arrowheads show the width of the hindbrain primordium, indicating the extent of convergent and extension of these cells. (n = 13, 19, 8, 10, 7 embryos). D Box and whisker plot of length of forebrain and midbrain primordia in control (blue), Wnt8a (orange), Vangl2 (gray), Wnt8a/Vangl2 (yellow) and Wnt8a/Vangl2/IRSp534K (green) 24 hpf larvae (μm). Measured from anterior forebrain pax6a expression to the position of the midbrain-hindbrain boundary (MHB) shown by horizontal black line (C). (n = 6, 12, 4, 10, 7 embryos). E Box and whisker plot of maximum width of hindbrain primordia in control (blue), Wnt8a (orange), Vangl2 (gray), Wnt8a/Vangl2 (yellow) and Wnt8a/Vangl2/IRSp534K (green) 24hpf larvae (μm). Measured from maximum width of hindbrain pax6a expression shown by yellow arrowheads (C). (n = 5, 11, 5, 8, 7 embryos). D, E Data represented as box and whisker plots. Whiskers define the minimum and maximum values. Bounds of box indicate the 25th and 75th percentile. center line indicates the median. Cross indicates mean. Outliers and inner points shown. Statistical significance: p ≤ 0.05. D, E One-way ANOVA tests plus Tukey’s post-hoc test. SEM = 1. Source data are provided as a Source Data file.
|