
- Title
-
Dietary inclusion of royal jelly modulates gene expression and activity of oxidative stress enzymes in zebrafish
- Authors
- Aksakal, E., Ekinci, D., Supuran, C.T.
- Source
- Full text @ J Enzyme Inhib Med Chem

Female (a) and male (b) zebrafish ( |
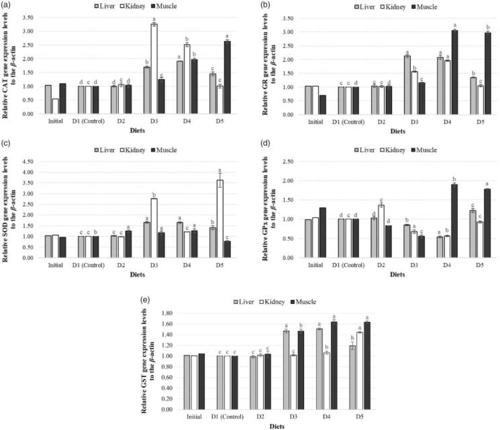
Expression levels of CAT (a), GR (b), SOD (c), GPx (d) and GST (e) genes in three different tissues of zebrafish among experimental diet groups. |

Gene expression heat map following different diet exposures. Values depict mean fold change (RQ) values versus control group. The bar is the colour key depicting fold change levels. Green signifies down-regulation and red upregulation. (For interpretation of the references to colour in this figure legend, the reader is referred to the Web version of this article.). |

Specific activity of CAT (a), GR (b), SOD (c), GPx (d) and GST (e) genes in three different tissues of zebrafish among experimental diet groups. |

Pearson’s correlation was calculated between the enzyme activity and gene expression levels for CAT, SOD, GPx, GST and GR in all tissues. Any significant correlation was not observed for all enzymes. |