
Image
|
Figure Caption
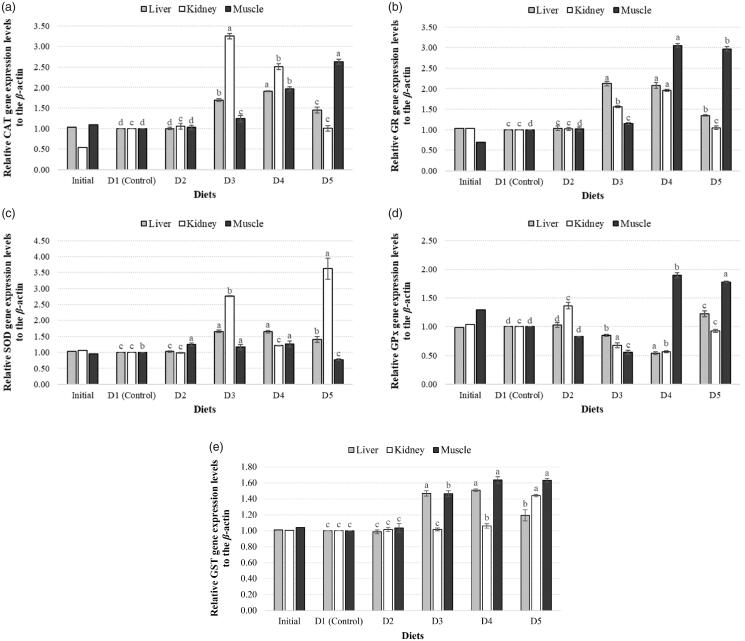
Figure 2.
Expression levels of CAT (a), GR (b), SOD (c), GPx (d) and GST (e) genes in three different tissues of zebrafish among experimental diet groups.
Acknowledgments
This image is the copyrighted work of the attributed author or publisher, and
ZFIN has permission only to display this image to its users.
Additional permissions should be obtained from the applicable author or publisher of the image.
Full text @ J Enzyme Inhib Med Chem