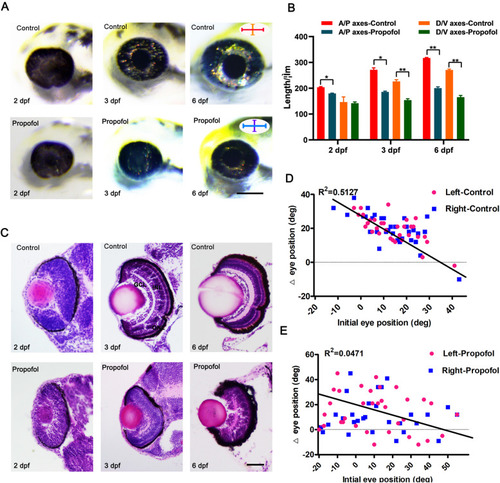
Propofol treatment results in microphthalmia and defects in retinal lamination and function. a Compared with control embryos, propofol-treated embryos (5 μg/ml propofol) at 2, 3, and 6 days postfertilization (dpf) display a reduction in eye size. b Measurements of absolute eye size along the anteroposterior (A/P) and dorsoventral (D/V) axes at 2, 3, and 6 dpf. n = 12. Error bars indicate the standard error of the mean. c Transverse histological sections of retinas of control and propofol-treated embryos (5 μg/ml propofol) at 2, 3, and 6 dpf. Eyes of propofol-treated embryos (5 μg/ml propofol) are smaller than control eyes, and the ganglion cell layer, inner nuclear layer, and outer nuclear layer are not morphologically identifiable in the retinas of propofol-treated embryos at 3 dpf. The dorsal side is up in all images. n = 7. d, e In response to prey, the extent of eye rotation is linearly associated with the initial position of the eye in control larvae at 6 dpf; in propofol-treated larvae (5 μg/ml propofol), there is no convergent eye movement. n = 35. a Scale bar, 100 μm. c Scale bar, 35 μm

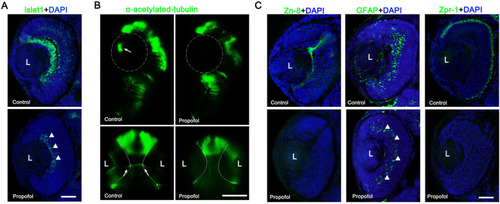
Propofol impairs the differentiation of retinal neurons and glia. Immunohistochemical analysis of markers (green) of neuronal and glial differentiation at 3 d postfertilization (dpf) (a, c) and 2 dpf (b). DNA, blue. a, b Although the retinas of propofol-treated embryos (5 μg/ml propofol) contain an occasional ganglion cell (a, arrowheads), optic axon tracts are absent (b). L, lens. The dotted line indicates the area of the eye. Arrows indicated optic axon tracts. c Ganglion cells (zn-8), Müller cells (GFAP), and red/green cones (zpr-1). With the exception of Müller cells (arrowheads), all late-differentiated cell types are absent. n = 5. Scale bar, 75 μm

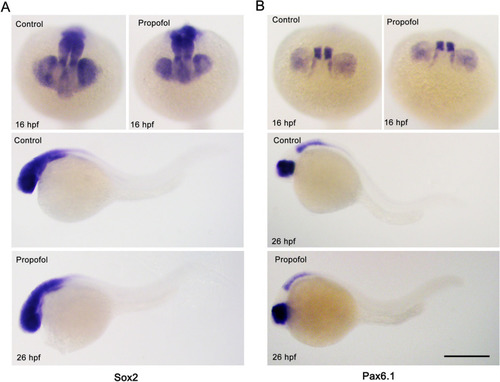
Propofol does not affect the specification of retinal progenitor cell identity. a, b The expression domains of both control and propofol-treated embryos (5 μg/ml propofol) at 16 and 26 h postfertilization (hpf) are shown for sox2 (a) and pax6.1 (b). The expression patterns of these progenitor identity markers are normal compared with those of control embryos. n = 18. Scale bar, 100 μm

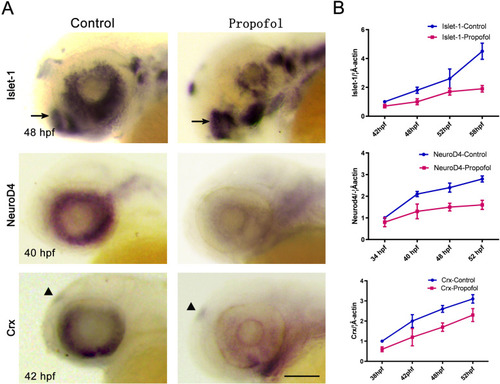
Propofol impairs the specification of retinal cell types. a, b Whole-mount in situ hybridization (a) and real-time quantitative polymerase chain reaction (b) were performed to detect the indicated genes (isl1, neurod4, and crx) at the indicated time points in control and propofol-treated embryos (5 μg/ml propofol). Expressions in the brain (isl1) and pineal body (crx) are indicated by arrows. a Lateral views. n = 21. Scale bar, 75 μm

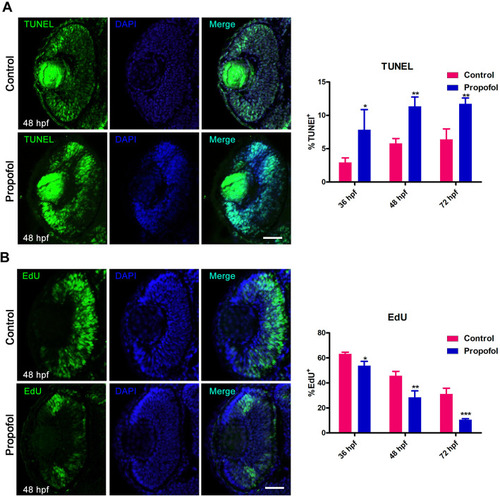
Propofol increases cell death and decreases the number of S-phase cells in retinas. a The number of terminal deoxynucleotidyl transferase dUTP nick-end labeling-positive cells (green) in the retinas of propofol-treated embryos (5 μg/ml propofol) at 36, 48, and 72 h postfertilization (hpf) is increased compared with that in controls. DNA, blue. n = 4. Scale bar, 25 μm. b EdU exposure at 36, 48, and 72 hpf decreases the proportion and mislocalization of S-phase cells in the retinas of propofol-treated embryos (5 μg/ml propofol) compared with control retinas. Error bars indicate the SEM. *, p < 0.05 and **, p < 0.01. n = 4. Scale bar, 18 μm

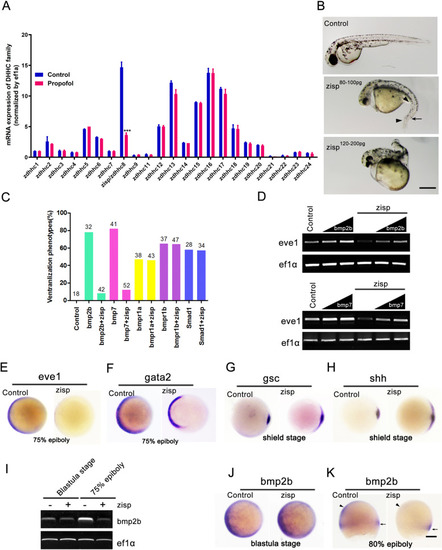
Zisp overexpression mimics noggin overexpression activity and acts upstream of the bone morphogenetic protein (BMP) receptor. a Quantitative reverse transcription polymerase chain reaction (qRT-PCR) analysis of mRNA levels of 24 known palmitoyl acyltransferases in propofol-treated retinas (5 μg/ml propofol). Ef1a was used as loading control. n = 3. b Injection of zisp mRNA induced dorsalization phenotypes, including an up-turned tail (arrow), a reduction of tail fin (arrowheads), and a reduction of tail and trunk. n = 13. Scale bar, 15 mm. c Zisp inhibited ventralization phenotypes by BMP ligands (bmp2b and bmp7) but not by BMP receptors (bmpr1a and bmpr1b) or Smad1. Numbers indicate the number of embryos scored. n = 3. d Zisp inhibited bmp2b- and bmp7-induced eve1 expression. ef1α was used as an RT-PCR control. n = 3. e–h Following zisp overexpression, the eve1 and gata2 expression domains are greatly reduced (e, f), whereas the shh and gsc territories appear to have expanded (g, h). n = 17. i–k Following zisp overexpression, bmp2b expression is still present at the blastula stage (j), whereas it is lost in the ventral blastoderm (arrowheads) and maintained in the marginal zone (arrows) (k). e–h, j Animal pole views. k Lateral views. Scale bar, 75 μm

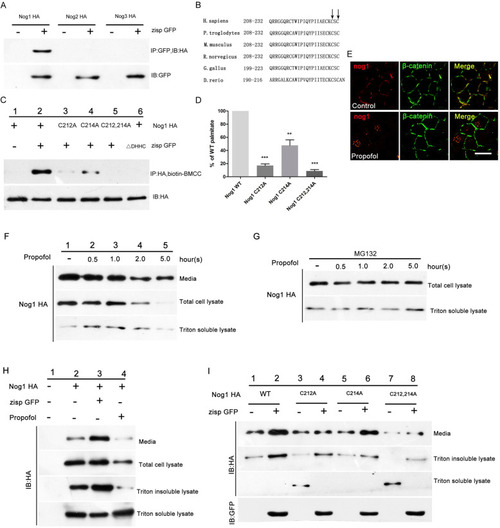
Palmitoylation increases the secretion and activity of Noggin-1. a Noggin-1 binds to Zisp. Embryos were co-transfected with green fluorescent protein (GFP)-tagged zisp and hemagglutinin (HA)-tagged nog (nog1, nog2, and nog3). Immunoprecipitation with anti-HA was performed, followed by western blotting for GFP. Zisp significantly enhanced Noggin-1 expression, while Noggin-2 and Noggin-3 were not detected. n = 3. b Sequence alignment of Noggin-1 proteins. The region containing residues 208–232 of zebrafish Zisp is aligned to that of other species. The arrows show the potential palmitoylation sites near the C-terminus. c, d Zisp induced palmitoylation of wild-type HA-tagged Noggin-1 but not of the mutant form of Noggin-1. However, Zisp △ Asp-His-His-Cys failed to palmitoylate HA-tagged Noggin-1. Values were first normalized with respect to the expression levels, and then, the expression of mutant forms was normalized to that of the wild-type proteins (d). n = 3. Error bars indicate the standard error of the mean. **p < 0.01 and ***p < 0.001. e Expression of Noggin-1 in the retinas of propofol-treated zebrafish (5 μg/ml propofol) was analyzed by immunofluorescence staining at 32 h postfertilization. The membranes were labeled with an anti-β-catenin antibody. n = 3. Scale bar, 100 μm. f Secretion of Noggin-1 was blocked by propofol. n = 3. g The proteasome inhibitor MG132 stabilized intracellular Noggin-1 (total cell lysate) and Noggin-1 in the soluble fraction (Triton-soluble lysate). n = 3. h GFP-labeled Zisp increased Noggin-1 secretion into the medium, while propofol blocked membrane targeting and secretion of transfected nog1. n = 3. i Cysteines 212 and 214 mediate part of Zisp activity. After co-transfection of zisp and nog1 (wild-type or mutant) constructs into RPE1 cells, mutation of the cysteine residues reduced the basal level of Noggin-1 secretion into the medium. n = 3

Acknowledgments
This image is the copyrighted work of the attributed author or publisher, and ZFIN has permission only to display this image to its users. Additional permissions should be obtained from the applicable author or publisher of the image. Full text @ Stem Cell Res. Ther.