
- Title
-
Rutin inhibits DRP1-mediated mitochondrial fission and prevents ethanol-induced hepatotoxicity in HepG2 cells and zebrafish
- Authors
- Choi, Y., Seo, H., Cho, M., Kim, J., Chung, H.S., Lee, I., Kim, M.J.
- Source
- Full text @ Animal Cells Syst (Seoul)

Chemical structure of rutin (a).and cell viability of rutin and ethanol treated HepG2 cells and zebrafish larvae. (b) Viability of HepG2 cells treated with different concentrations of rutin (0–10 μM) for 1 day. (c) Viability of HepG2 cells at different concentration of ethanol (0–2%). (d) Viability of HepG2 cells treated with ethanol and rutin. (e) MTT assay of zebrafish larvae (4 dpf) incubated with different concentrations of rutin (0–1 μM) and 2% ethanol for 24 h. Data are means ± SEM of triple independent experiments. * |

The effect of rutin on hepatic steatosis in zebrafish larvae exposed to ethanol. (a) Representative images of Oil Red O staining. Zebrafish larvae (4 dpf) were incubated with 2% ethanol and/or 1 μM rutin for 24 h and hepatic fatty acid accumulation was measured by Oil Red O density. Marked areas indicate the livers of larvae. Quantitative analysis of relative intensities of Oil Red O staining of larval livers is presented. (b) Zebrafish total RNA was analyzed to determine c/ebpα and pparγ expression. Data are shown as means ± SEM of measurements obtained from each of the 20 larvae based on 3 independent experiments. *p < 0.05, **p < 0.01 and ***p < 0.001. |
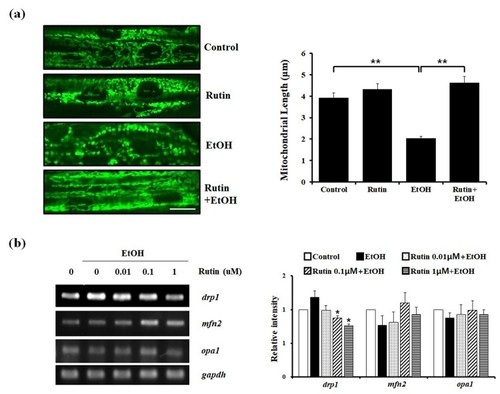
The effect of rutin on mitochondrial dynamics in zebrafish larvae. (a) Representative confocal live images of the mitochondria (green fluorescent) with effect of rutin and ethanol on zebrafish larvae muscle. |

Rutin reduces lipid accumulation on HepG2 cells induced by ethanol. (a) Representative images of Oil Red O. HepG2 cells were incubated with 1% ethanol and/or rutin. Fatty acid accumulation was observed with Oil Red O. Images were acquired with Leica microscope (X40). Bar = 10 μm (b) Quantitative analysis of relative intensities of Oil Red O. |

The effect of rutin on mitochondrial dynamics in HepG2 cells (a) Representative confocal live images of mitochondria-targeted DsRed showing the effect of rutin. HepG2 cells transfected with mito-DsRed vector were incubated with 1 μM rutin and/or 1% ethanol for 24 h. Bar = 5 μm. Quantitative analysis of mitochondrial length in HepG2 cells. Data shown are the means ± SEM of measurements obtained from 50 individual cells based on three independent experiments. (b–c) Effects of rutin under ethanol exposure on the expressions of |