
- Title
-
Androgenic activation, impairment of the monoaminergic system and altered behavior in zebrafish larvae exposed to environmental concentrations of fenitrothion
- Authors
- Faria, M., Prats, E., Rosas Ramírez, J.R., Bellot, M., Bedrossiantz, J., Pagano, M., Valls, A., Gomez-Canela, C., Porta, J.M., Mestres, J., Garcia-Reyero, N., Faggio, C., Gómez Oliván, L.M., Raldua, D.
- Source
- Full text @ Sci. Total Environ.

Short-term (24 h) exposure to environmental concentrations of fenitrothion induces neurotoxicity in 8 days-post fertilization zebrafish larvae. (A) Analysis of the basal locomotor activity (BLA), showing hypoactivity of larvae exposed to 1.7–170 ng/L and 17 μg/L. (B) Analysis of the visual-motor response (VMR), showing a significant increase in the mobility of larvae exposed to 0.17–17 μg/L during the first 2 min of the light/dark challenge. (C) Analysis of the acoustic/vibrational escape response shows a significant decrease of the escape response evoked by one tapping stimulus in larvae exposed to 0.17–17 μg/L fenitrothion, and an increase in the response in larvae exposed to 17 ng/L. (D) Kinematics of the vibrational escape response show an increase in the SLC/LLC ratio in larvae exposed to 17 μg/L (N.R.: non-responder; SLC: short-latency C-bend; LLC: long-latency C-bend). Data reported as mean ± SEM (n = 81–167 for BLA, n = 76–154 for VMR, n = 73–148 for acoustic/vibrational escape response and n = 12–15 for kinematic analysis SLC/LLC ratio) (E) Gene expression of five selected transcriptional markers of neurotoxicity in zebrafish larvae control or exposed to four Environmental concentrations of fenitrothion. Boxplot representation of ΔΔCt values, with the box indicating the 25th and 75th percentiles and the whiskers the maximum and minimum values. The thin line within the box marks the median (n = 6–8 pools). *P < 0.05, **P < 0.01, ***P < 0.001; one-way ANOVA with Dunnett's multiple comparison test. Data from 2 to 4 independent experiments. |
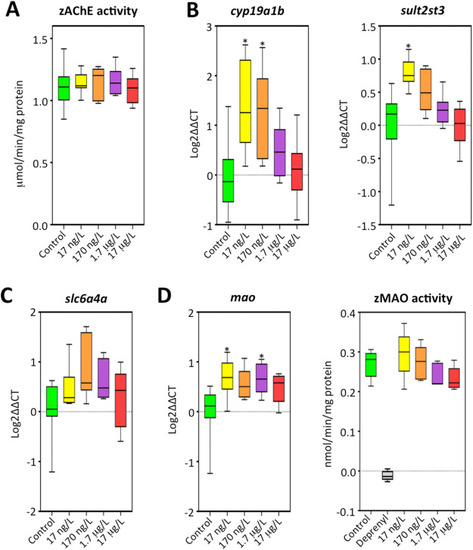
Validation in zebrafish larvae of in silico predicted molecular targets of fenitrothion. (A) Zebrafish acetylcholinesterase (zAChE) activity in control and fenitrothion exposed 8 days-post fertilization zebrafish larvae, showing that the selected concentrations of fenitrothion are not able to induce a significant inhibition of AChE activity (P > 0.05; one-way ANOVA with Dunnett's multiple comparison test). Data from 2 independent experiments (n = 8–9). (B) The potential androgenic or anti-androgenic effect of fenitrothion on zebrafish arvae was assessed by analyzing the expression of cyp19a1b and sult2st3, two well established markers of androgenicity in zebrafish. (C) Expression of slc6a4a (zebrafish SERT) in control and fenitrothion exposed zebrafish larvae. (D) Expression of mao and MAO activity in control and fenitrothion exposed zebrafish larvae. Boxplot representation with the box indicating the 25th and 75th percentiles and the whiskers the maximum and minimum values. The thin line within the box marks the median. *P < 0.05; One way ANOVA followed by Dunnett's multiple comparison test was used for zAChE activity and cyp19a1b, sult2st3 and mao expression, whereas Kruskal Wallis test followed by Dunn's multiple comparison test against the control values was used for slc6a4 expression and MAO activity. |
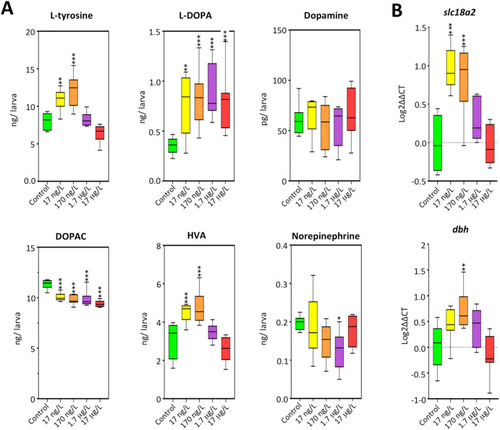
Effect of environmental concentrations of fenitrothion on the monaminergic system in zebrafish larvae. (A) Effects of fenitrothion on the levels of some neurochemicals from the monaminergic system. (B) Effects of fenitrothion on the expression levels of slc18a2 (gene encoding zebrafish VMAT2) and dbh. Boxplot representation of ng or pg of neurochemical per larva (A) or ΔΔCt values (B), with the box indicating the 25th and 75th percentiles and the whiskers the maximum and minimum values. The thin line within the box marks the median [n = 8 pools (A) or 6–8 pools (B)].*P < 0.05, **P < 0.01, ***P < 0.001; one-way ANOVA with Dunnett's multiple comparison test. Data from 2 to 4 independent experiments. |