
- Title
-
Age-related loss of auditory sensitivity in the zebrafish (Danio rerio)
- Authors
- Zeng, R., Brown, A.D., Rogers, L.S., Lawrence, O.T., Clark, J.I., Sisneros, J.A.
- Source
- Full text @ Hear. Res.
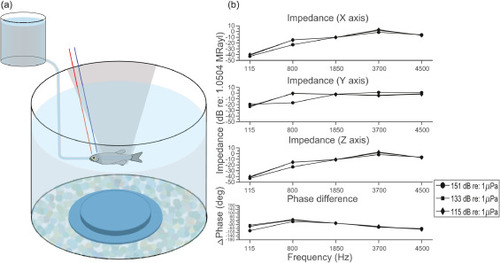
(a) Schematic of the experimental setup. The animal was suspended in a mesh sling in the middle of the experimental tank (8.5 cm below water surface, and 8 cm above underwater speaker). Fresh aerated water was delivered by an elevated water reservoir with a water line that continuously provided fresh water into the fish's buccal cavity. Two electrodes were directly inserted subcutaneously into the skin on the fish's head. The positive electrode (red) was inserted between the nares on the rostral part of the head, and the negative electrode was inserted in the midline of tested fish at the opercular opening above the otic capsule (where the inner ear is located, colored in blue). The ground electrode (not shown) was placed in the tank water. (b) Acoustic characteristics (impedance and phase difference between sound pressure and particle velocity) of the experimental tank and the speaker. Top 3 panels: Acoustic impedance [ratio of sound pressure (dB re: 1 µPa) to particle velocity (dB re: 1 ms−1)] in three axes (X, Y, Z) relative to 1.504 MRayls (the reference impedance for a free-field in fresh water at 28 °C) is plotted for all tested frequencies at three representative sound pressure levels: 115, 133, 151 dB re: 1µPa. Measurements were made using a triaxial accelerometer placed in the center of the tank and water column (8 cm above the speaker and 8.5 cm below the water surface). Multiple measurements (n = 8) for both sound pressure and particle velocity were made at each frequency and sound pressure level. Data plotted are mean ± 1 standard deviation. Bottom panel: Plotted are the phase differences (ΔΦp,v) between the pressure and particle velocity wave. Multiple phase difference measurements (n = 8) were made at each frequency and sound pressure level. Data plotted are mean ± 1 standard deviation. |
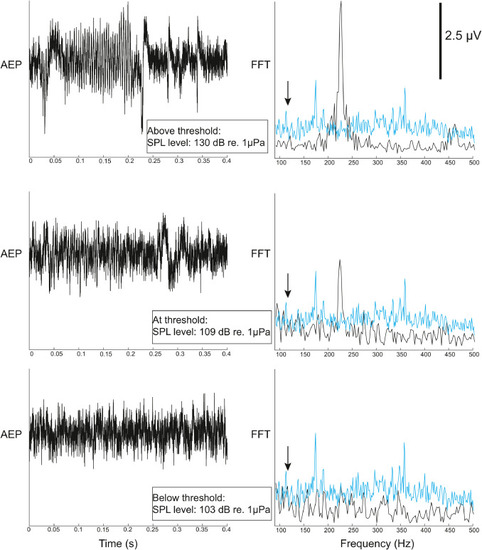
Representative AEP recordings. The left panel represents the average AEP waveforms recorded from a single individual in response to 115 Hz tones at three different SPLs: 103, 109 and 130 dB re: 1 µPa (peak-to-peak measurements) with alternating polarity [refer to Methods section]. The stimulus duration was 200 ms. The right panel represents FFT of AEP waveforms (black) and FFT of background level (blue). When the stimulus is above threshold (top panel: SPL at 130 dB re: 1µPa), a prominent peak is observed in the FFT spectrum of the waveform at twice the stimulus frequency, here 230 Hz. This “double frequency response” is thought to reflect the nonlinear summation of oppositely oriented hair cell activation and subsequent firing of associated auditory afferent neurons (see text). The amplitude of the double-frequency component in the FFT is expected to decrease with decreasing stimulus amplitude (middle panel: SPL at 109 dB re: 1µPa), until its amplitude matches the background noise level (bottom panel: SPL at 103 dB re: 1 µPa). The system noise floor was defined as the mean noise FFT plus one standard deviation. For each stimulus frequency, threshold was determined as the lowest sound pressure level eliciting a “double-frequency” response at least 3 dB (i.e. twice the magnitude) above the system noise floor at that frequency. The downward pointing arrows indicate the stimulus frequency at 115 Hz. |
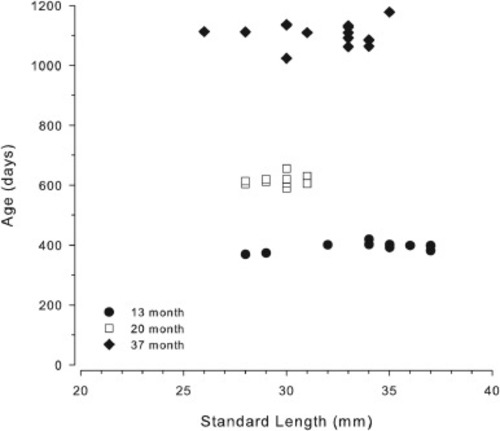
Standard length (SL; unit: cm) plotted as a function of age for all individuals within the three tested age groups. The correlation between age and SL was not-significant (Spearman's Rho: rs= −0.23, p = 0.14), indicating that length is an unreliable proxy for age in AB/WIK zebrafish (see text). |
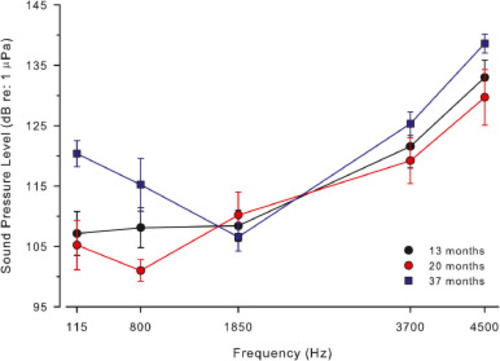
Averaged auditory evoked potential tuning curves based on sound pressure level (dB re: 1 μPa). Group mean thresholds are shown for the three tested age groups of AB/WIK zebrafish: 13 months (black, n = 13), 20 months (red, n = 12), 37 months (blue, n = 16). Error bars indicate 1 standard error of the mean. |
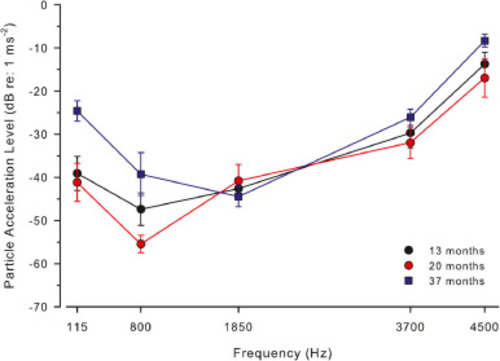
Averaged auditory evoked potential tuning curves based on particle acceleration level (re: 1 ms−2). Legend otherwise as in Fig. 4. |
Reprinted from Hearing Research, 403, Zeng, R., Brown, A.D., Rogers, L.S., Lawrence, O.T., Clark, J.I., Sisneros, J.A., Age-related loss of auditory sensitivity in the zebrafish (Danio rerio), 108189, Copyright (2021) with permission from Elsevier. Full text @ Hear. Res.