
|
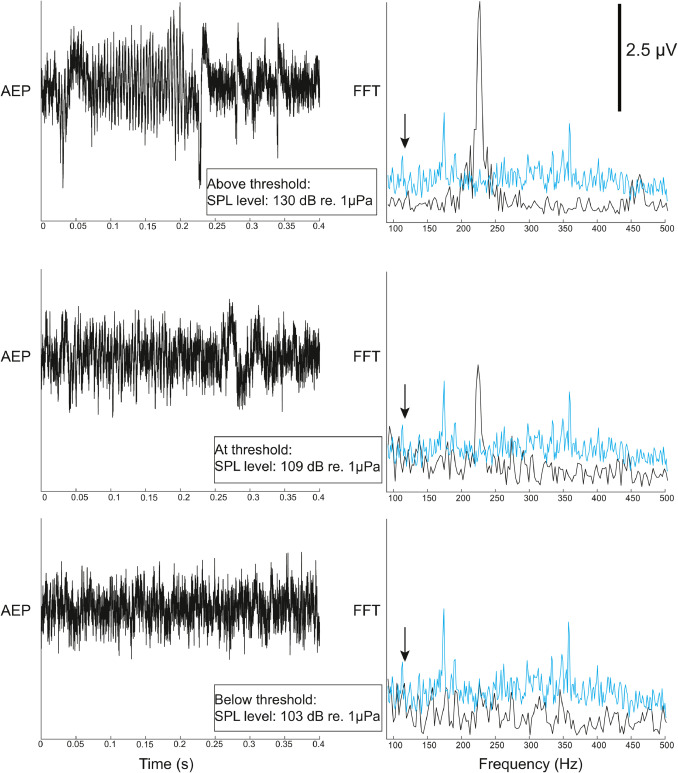
Fig. 2 Representative AEP recordings. The left panel represents the average AEP waveforms recorded from a single individual in response to 115 Hz tones at three different SPLs: 103, 109 and 130 dB re: 1 µPa (peak-to-peak measurements) with alternating polarity [refer to Methods section]. The stimulus duration was 200 ms. The right panel represents FFT of AEP waveforms (black) and FFT of background level (blue). When the stimulus is above threshold (top panel: SPL at 130 dB re: 1µPa), a prominent peak is observed in the FFT spectrum of the waveform at twice the stimulus frequency, here 230 Hz. This “double frequency response” is thought to reflect the nonlinear summation of oppositely oriented hair cell activation and subsequent firing of associated auditory afferent neurons (see text). The amplitude of the double-frequency component in the FFT is expected to decrease with decreasing stimulus amplitude (middle panel: SPL at 109 dB re: 1µPa), until its amplitude matches the background noise level (bottom panel: SPL at 103 dB re: 1 µPa). The system noise floor was defined as the mean noise FFT plus one standard deviation. For each stimulus frequency, threshold was determined as the lowest sound pressure level eliciting a “double-frequency” response at least 3 dB (i.e. twice the magnitude) above the system noise floor at that frequency. The downward pointing arrows indicate the stimulus frequency at 115 Hz.
Reprinted from Hearing Research, 403, Zeng, R., Brown, A.D., Rogers, L.S., Lawrence, O.T., Clark, J.I., Sisneros, J.A., Age-related loss of auditory sensitivity in the zebrafish (Danio rerio), 108189, Copyright (2021) with permission from Elsevier. Full text @ Hear. Res.